Copyright
©The Author(s) 2024.
World J Gastrointest Surg. Oct 27, 2024; 16(10): 3334-3342
Published online Oct 27, 2024. doi: 10.4240/wjgs.v16.i10.3334
Published online Oct 27, 2024. doi: 10.4240/wjgs.v16.i10.3334
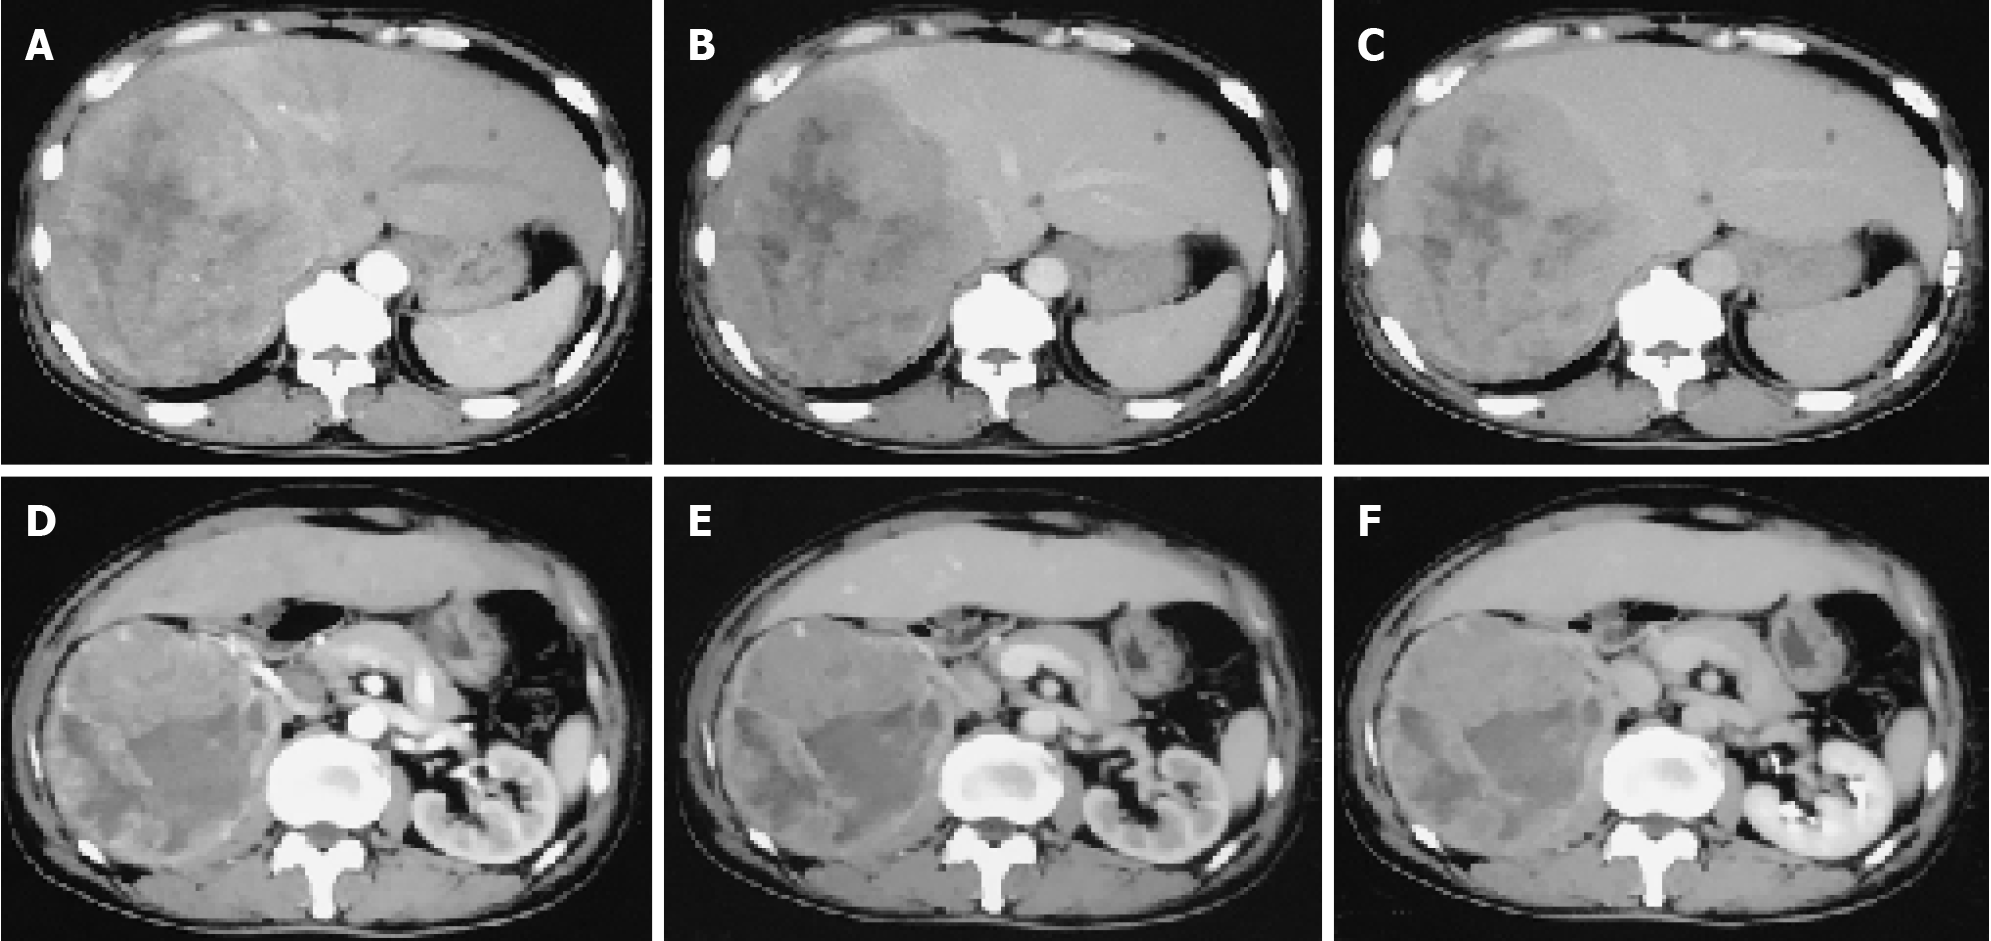
Figure 1 Images of the patient before hepatic artery perfusion chemotherapy.
A: Contrast-enhanced computed tomography (CT) scans showed a well-circumscribed mass with multiple low-density patchy shadows, measuring 140 cm × 16.0 cm in the right lobe of the liver during the arterial phase; B: Contrast-enhanced CT scans in the right lobe of the liver during the portal phase; C: Contrast-enhanced CT scans in the right lobe of the liver during the delayed phase; D: Contrast-enhanced CT scans showed a distinct soft tissue mass with clear-boundaries and low-density foci, measuring 115 cm × 12.0 cm, was identified in the upper pole of the right kidney during the arterial phase; E: Contrast-enhanced CT scans in the upper pole of the right kidney during the portal phase; F: Contrast-enhanced CT scans in the upper pole of the right kidney during the delayed phase.
- Citation: Yang HT, Wang FR, He N, She YH, Du YY, Shi WG, Yang J, Chen G, Zhang SZ, Cui F, Long B, Yu ZY, Zhu JM, Zhang GY. Massive simultaneous hepatic and renal perivascular epithelioid cell tumor benefitted from surgery and everolimus treatment: A case report. World J Gastrointest Surg 2024; 16(10): 3334-3342
- URL: https://www.wjgnet.com/1948-9366/full/v16/i10/3334.htm
- DOI: https://dx.doi.org/10.4240/wjgs.v16.i10.3334


