Copyright
©The Author(s) 2024.
World J Gastrointest Surg. Oct 27, 2024; 16(10): 3211-3223
Published online Oct 27, 2024. doi: 10.4240/wjgs.v16.i10.3211
Published online Oct 27, 2024. doi: 10.4240/wjgs.v16.i10.3211
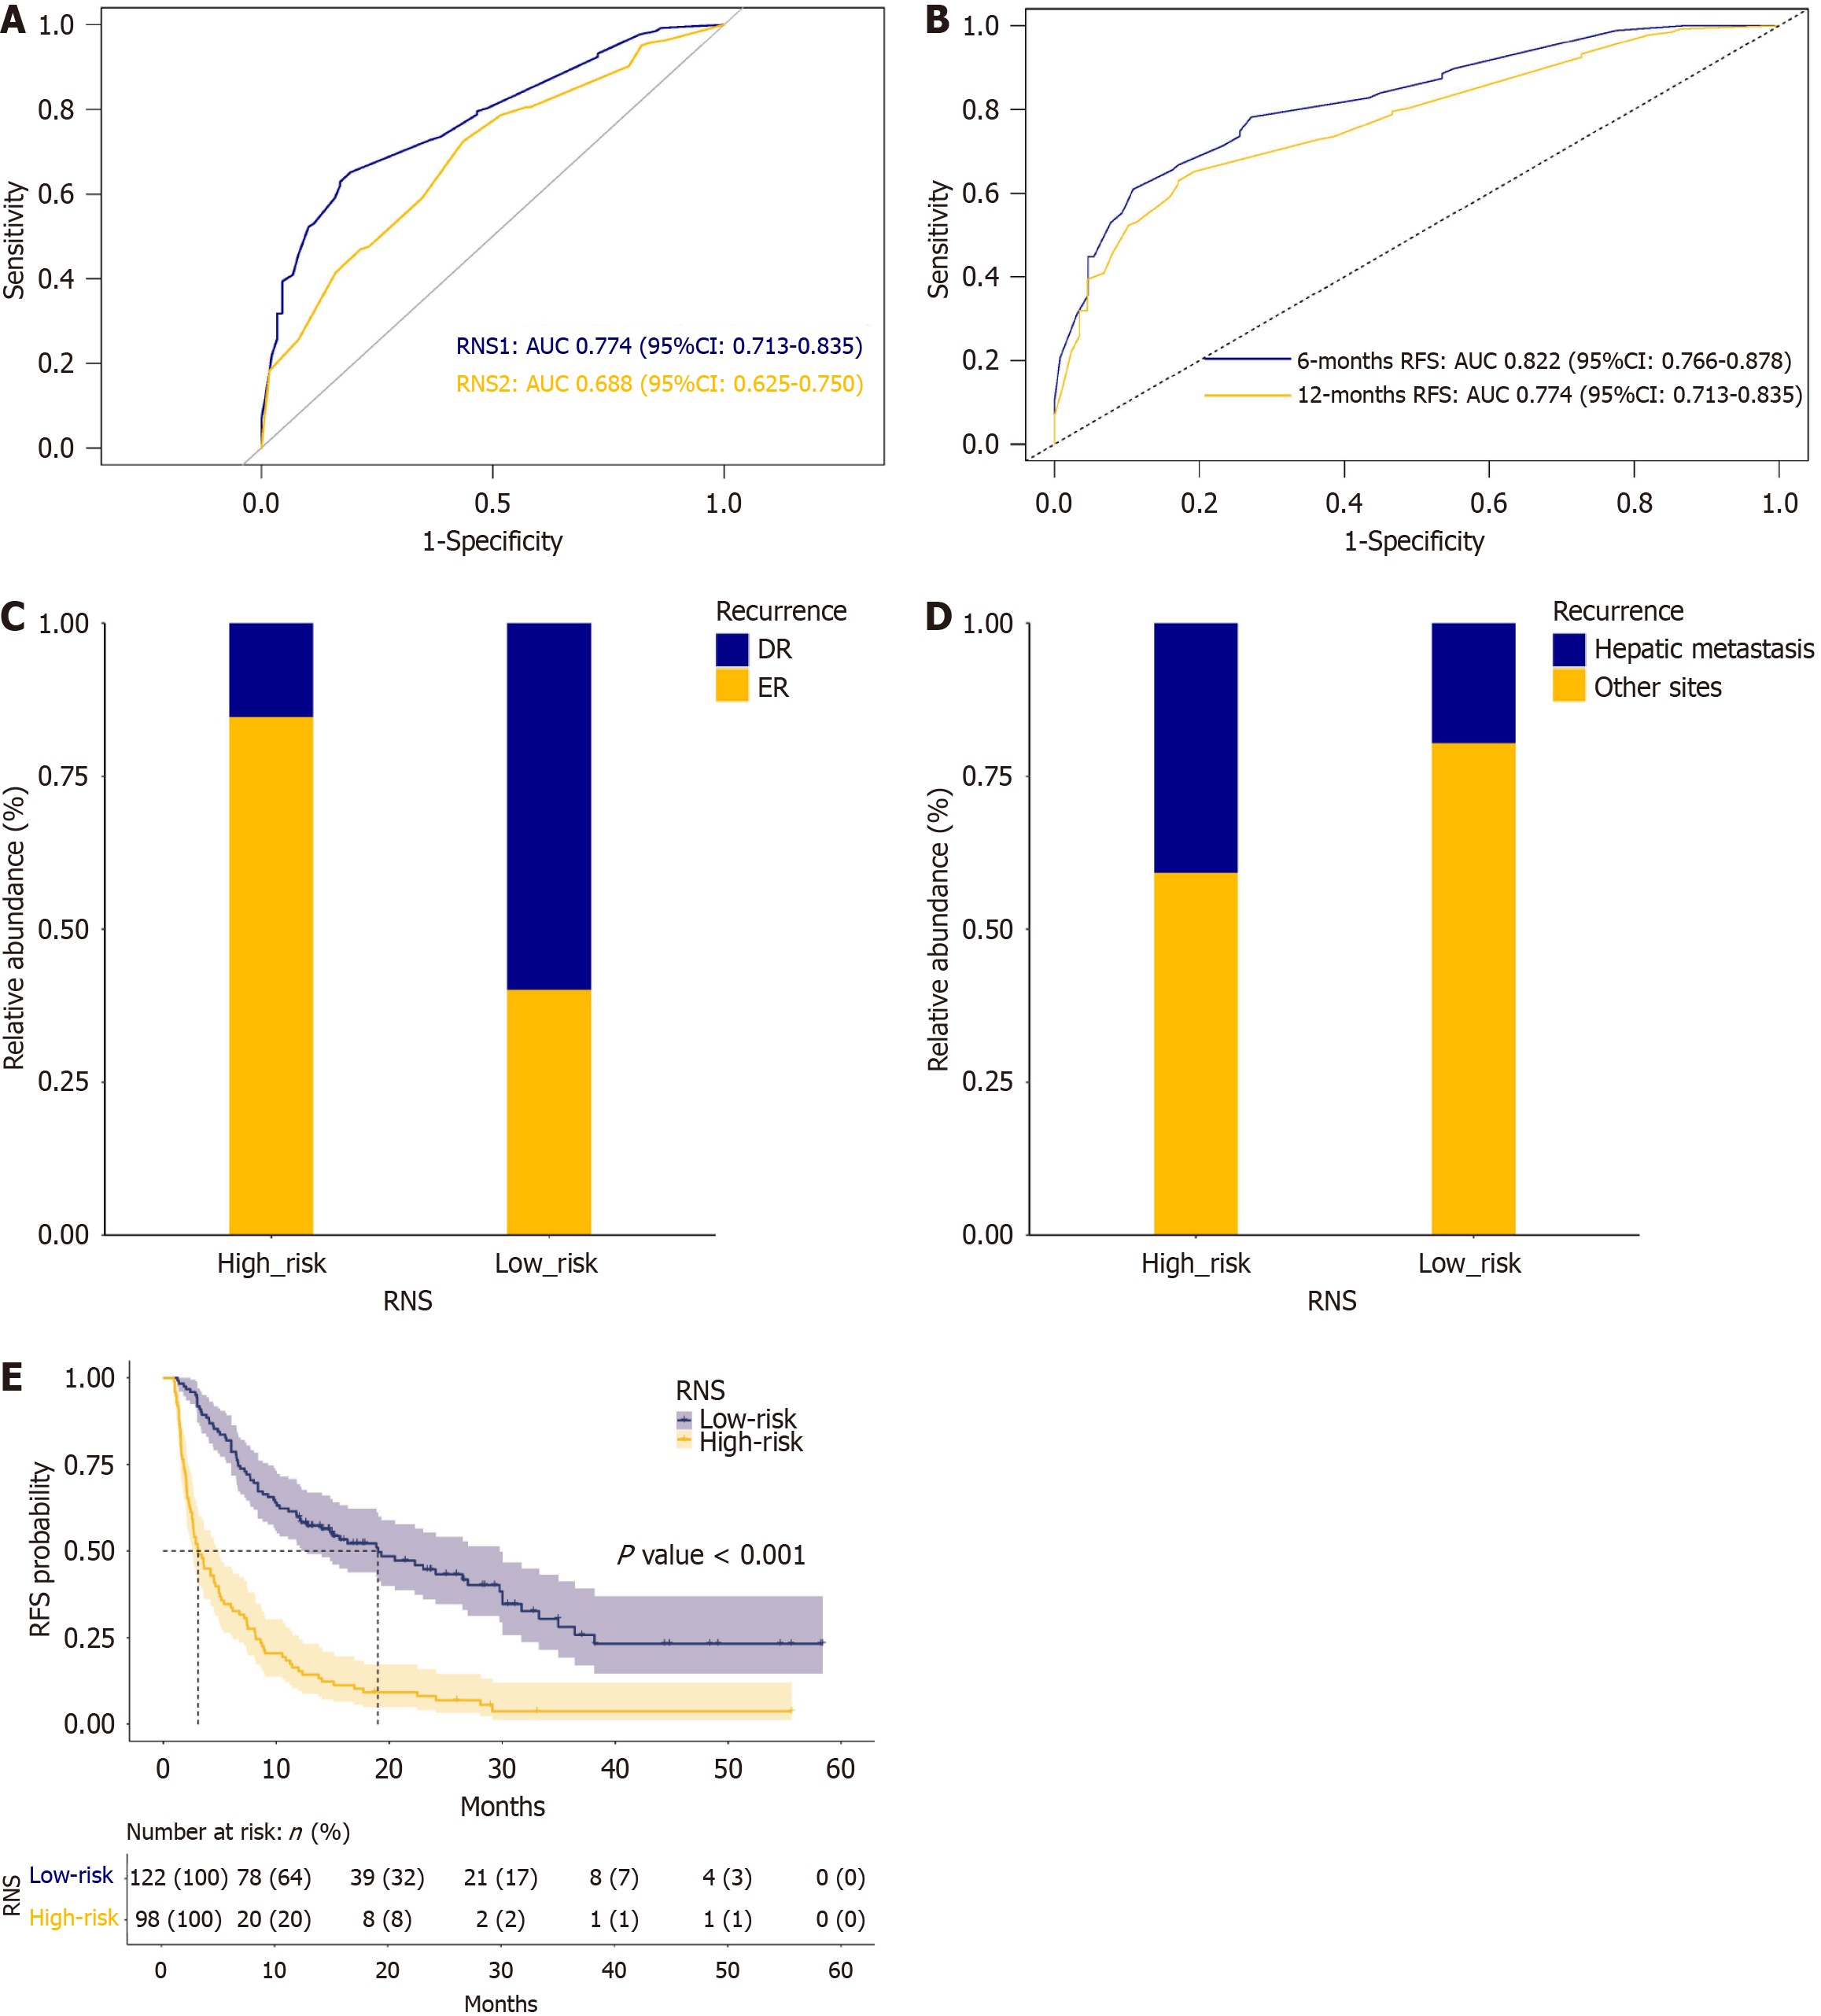
Figure 3 Receiver operating characteristic curve analysis of the nomogram, and stratified analysis of patients’ outcomes depending on recurrence nomogram score.
A: Receiver operating characteristic (ROC) curves of recurrence nomogram score (RNS) 1 [with postoperative serum tumor markers (STMs)] and RNS2 (without postoperative STMs) for predicting early recurrence (ER). The area under the curve (AUC) of RNS1 was greater than the AUC of RNS2 (P = 0.016); B: ROC curves of RNS (with postoperative STMs) for predicting ER in different time intervals. The AUC of RNS decreased with time; C: The stacked plot of both ER and delayed recurrence stratified by RNS. It showed that the ER ratio was significantly higher in high-risk group than in low-risk group (P < 0.001); D: The stacked plot of recurrence sites stratified by RNS. It showed that hepatic metastasis was more frequently observed in high-risk group compared with low-risk group (P = 0.001); E: Kaplan-Meier survival analysis of recurrence free survival (RFS) stratified by RNS. High-risk group had significantly poorer RFS compared with low-risk group. RNS: Recurrence nomogram score; AUC: Area under the curve.
- Citation: He H, Zou CF, Yang F, Di Y, Jin C, Fu DL. Postoperative serum tumor markers-based nomogram predicting early recurrence for patients undergoing radical resections of pancreatic ductal adenocarcinoma. World J Gastrointest Surg 2024; 16(10): 3211-3223
- URL: https://www.wjgnet.com/1948-9366/full/v16/i10/3211.htm
- DOI: https://dx.doi.org/10.4240/wjgs.v16.i10.3211


