Copyright
©The Author(s) 2024.
World J Gastrointest Surg. Oct 27, 2024; 16(10): 3171-3184
Published online Oct 27, 2024. doi: 10.4240/wjgs.v16.i10.3171
Published online Oct 27, 2024. doi: 10.4240/wjgs.v16.i10.3171
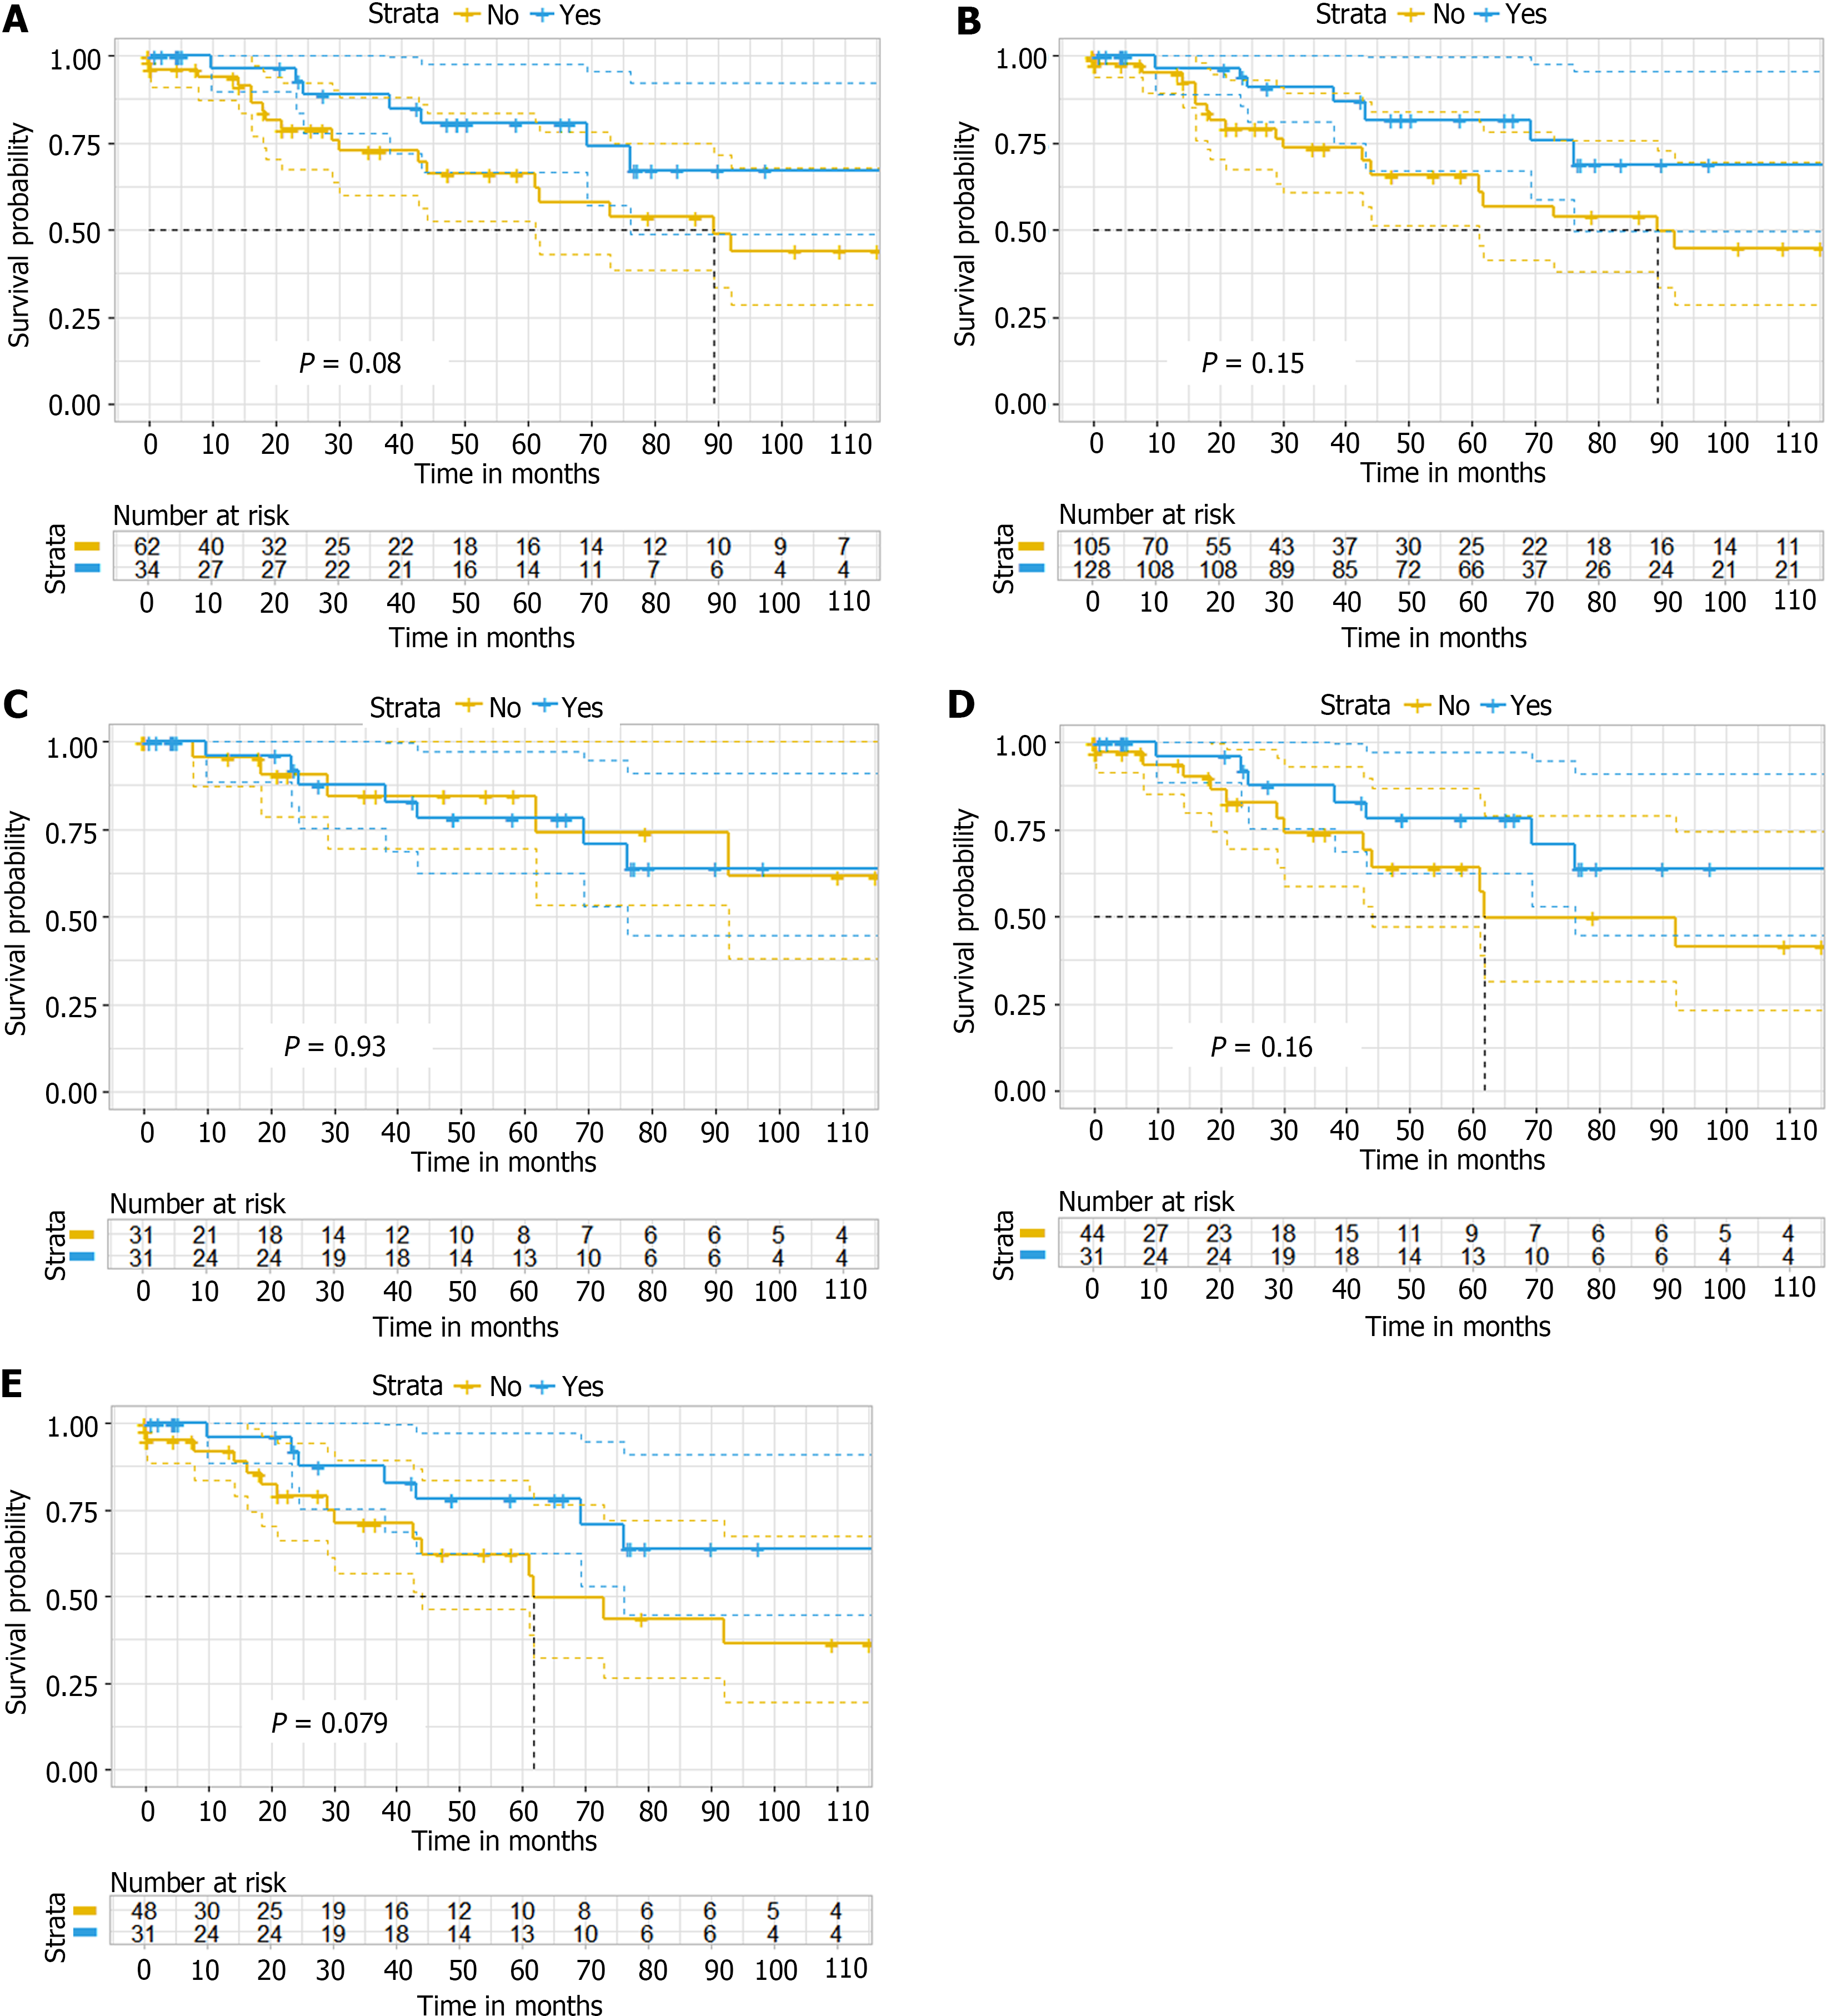
Figure 2 Kaplan-Meier survival curves according to adjuvant chemotherapy with lung metastases.
A: In the original cohort; B: After inverse probability of treatment-weighting analysis; C: After propensity score-matching analysis (ratio = 1); D: After propensity score-matching analysis (ratio = 2); E: After propensity score-matching analysis (ratio = 3).
- Citation: Gao Z, Wu SK, Zhang SJ, Wang X, Wu YC, Jin X. Adjuvant chemotherapy for isolated resectable colorectal lung metastasis: A retrospective study using inverse probability treatment weighting propensity analysis. World J Gastrointest Surg 2024; 16(10): 3171-3184
- URL: https://www.wjgnet.com/1948-9366/full/v16/i10/3171.htm
- DOI: https://dx.doi.org/10.4240/wjgs.v16.i10.3171


