Copyright
©The Author(s) 2023.
World J Gastrointest Surg. Sep 27, 2023; 15(9): 1919-1931
Published online Sep 27, 2023. doi: 10.4240/wjgs.v15.i9.1919
Published online Sep 27, 2023. doi: 10.4240/wjgs.v15.i9.1919
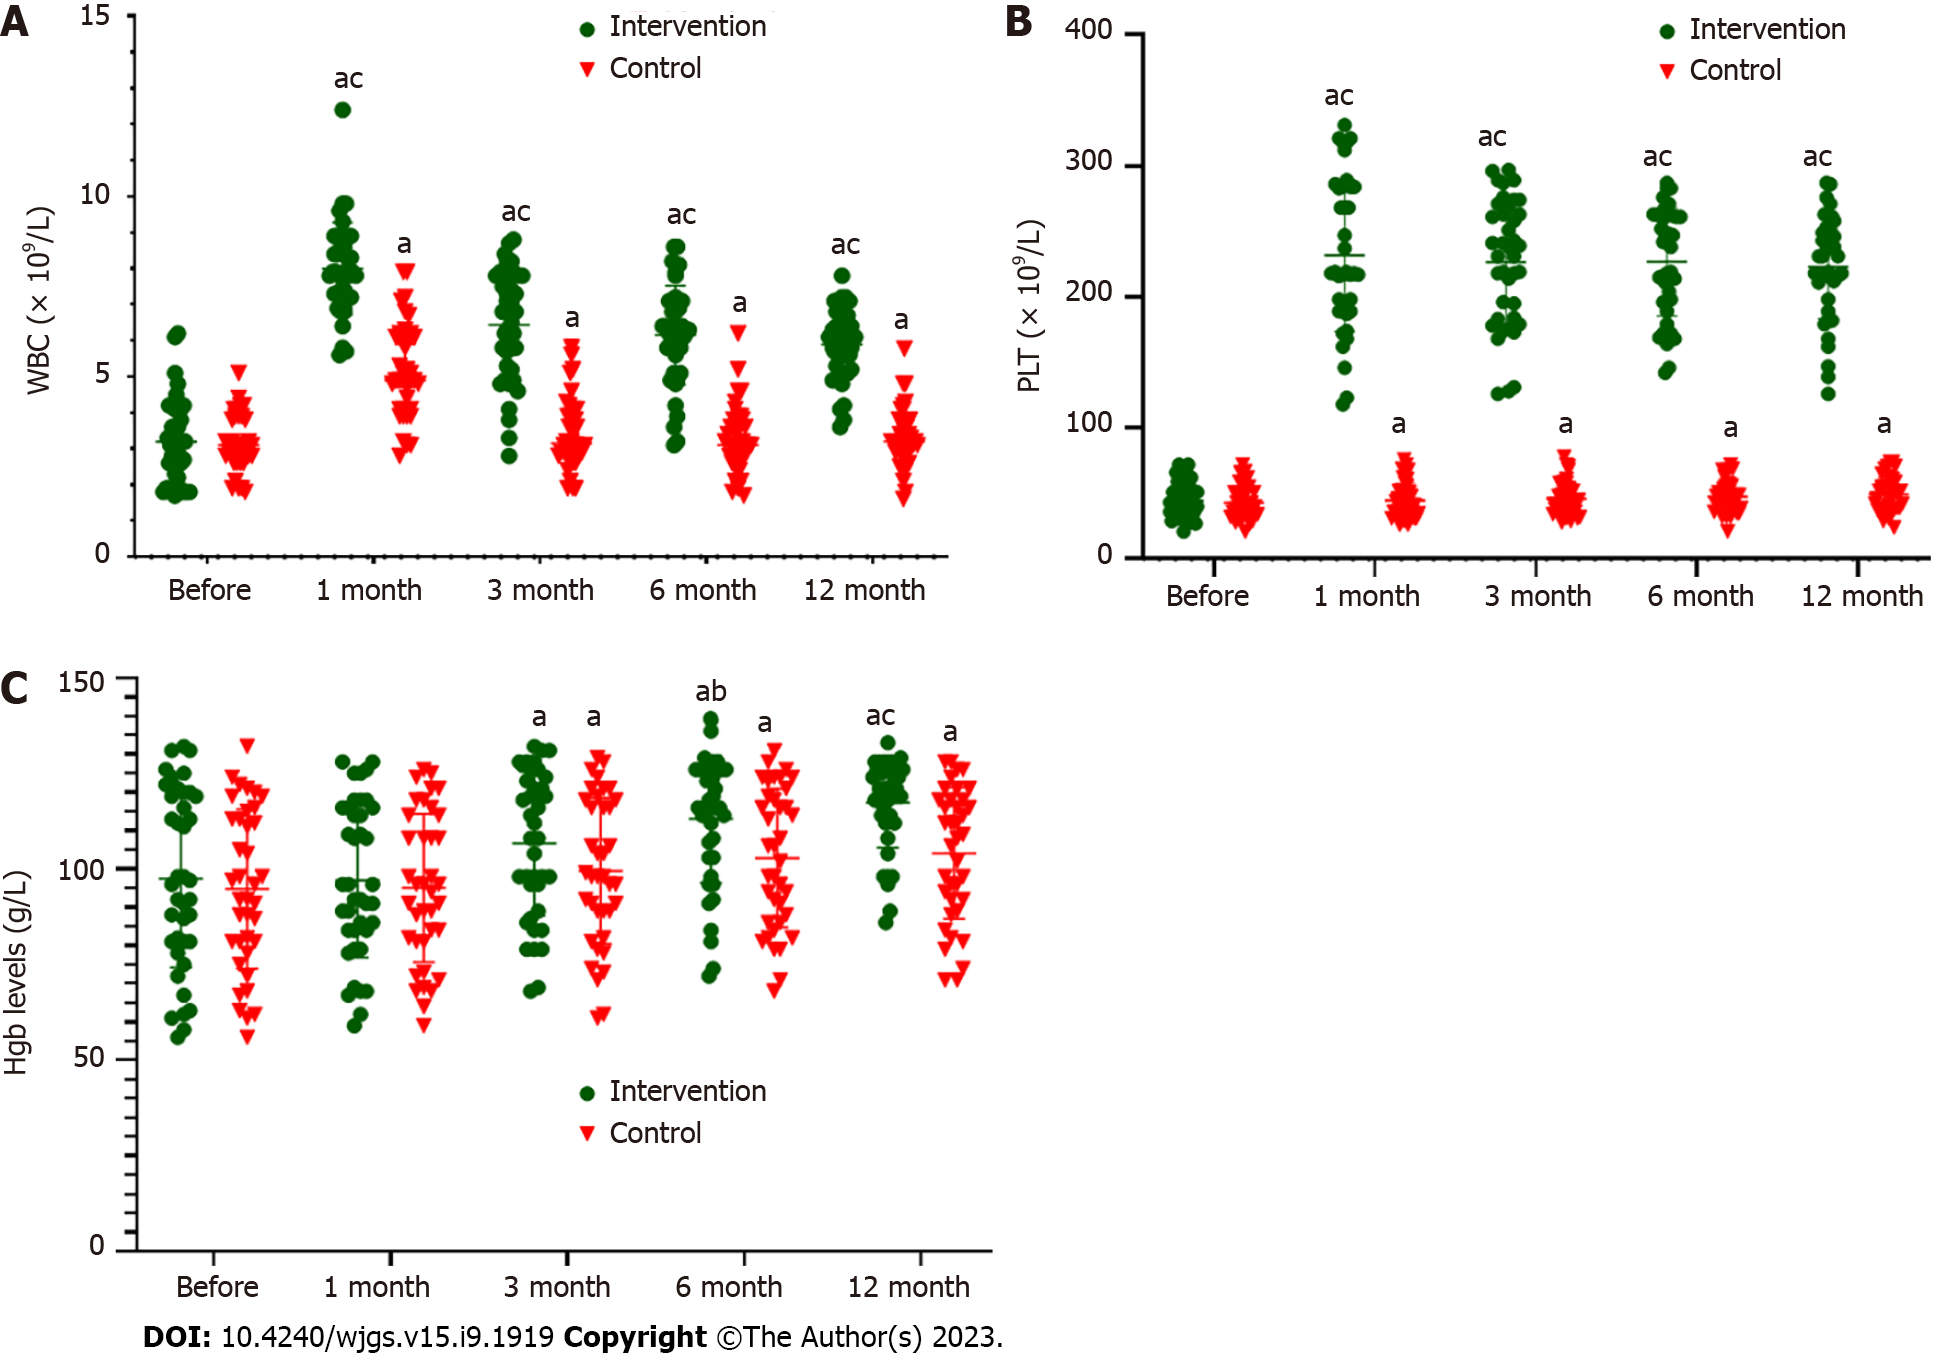
Figure 2 Scatter plots of white blood cell, platelet and hemoglobin levels before and after autologous bone marrow infusion in control and intervention groups.
A: Scatter plot of white blood cell count before and after autologous bone marrow infusion (ABMI) in both groups; B: Scatter plot of platelet count before and after ABMI in both groups; C: Scatter plot of hemoglobin level before and after ABMI in both groups. Compared with before ABMI, aP < 0.01; compared with control group, bP < 0.05, cP < 0.01. WBC: White blood cell; PLT: Platelet; Hgb: Hemoglobin.
- Citation: Liu BC, Cheng MR, Lang L, Li L, Si YH, Li AJ, Xu Q, Zhang H. Autologous bone marrow infusion via portal vein combined with splenectomy for decompensated liver cirrhosis: A retrospective study. World J Gastrointest Surg 2023; 15(9): 1919-1931
- URL: https://www.wjgnet.com/1948-9366/full/v15/i9/1919.htm
- DOI: https://dx.doi.org/10.4240/wjgs.v15.i9.1919


