Copyright
©The Author(s) 2023.
World J Gastrointest Surg. Jul 27, 2023; 15(7): 1317-1330
Published online Jul 27, 2023. doi: 10.4240/wjgs.v15.i7.1317
Published online Jul 27, 2023. doi: 10.4240/wjgs.v15.i7.1317
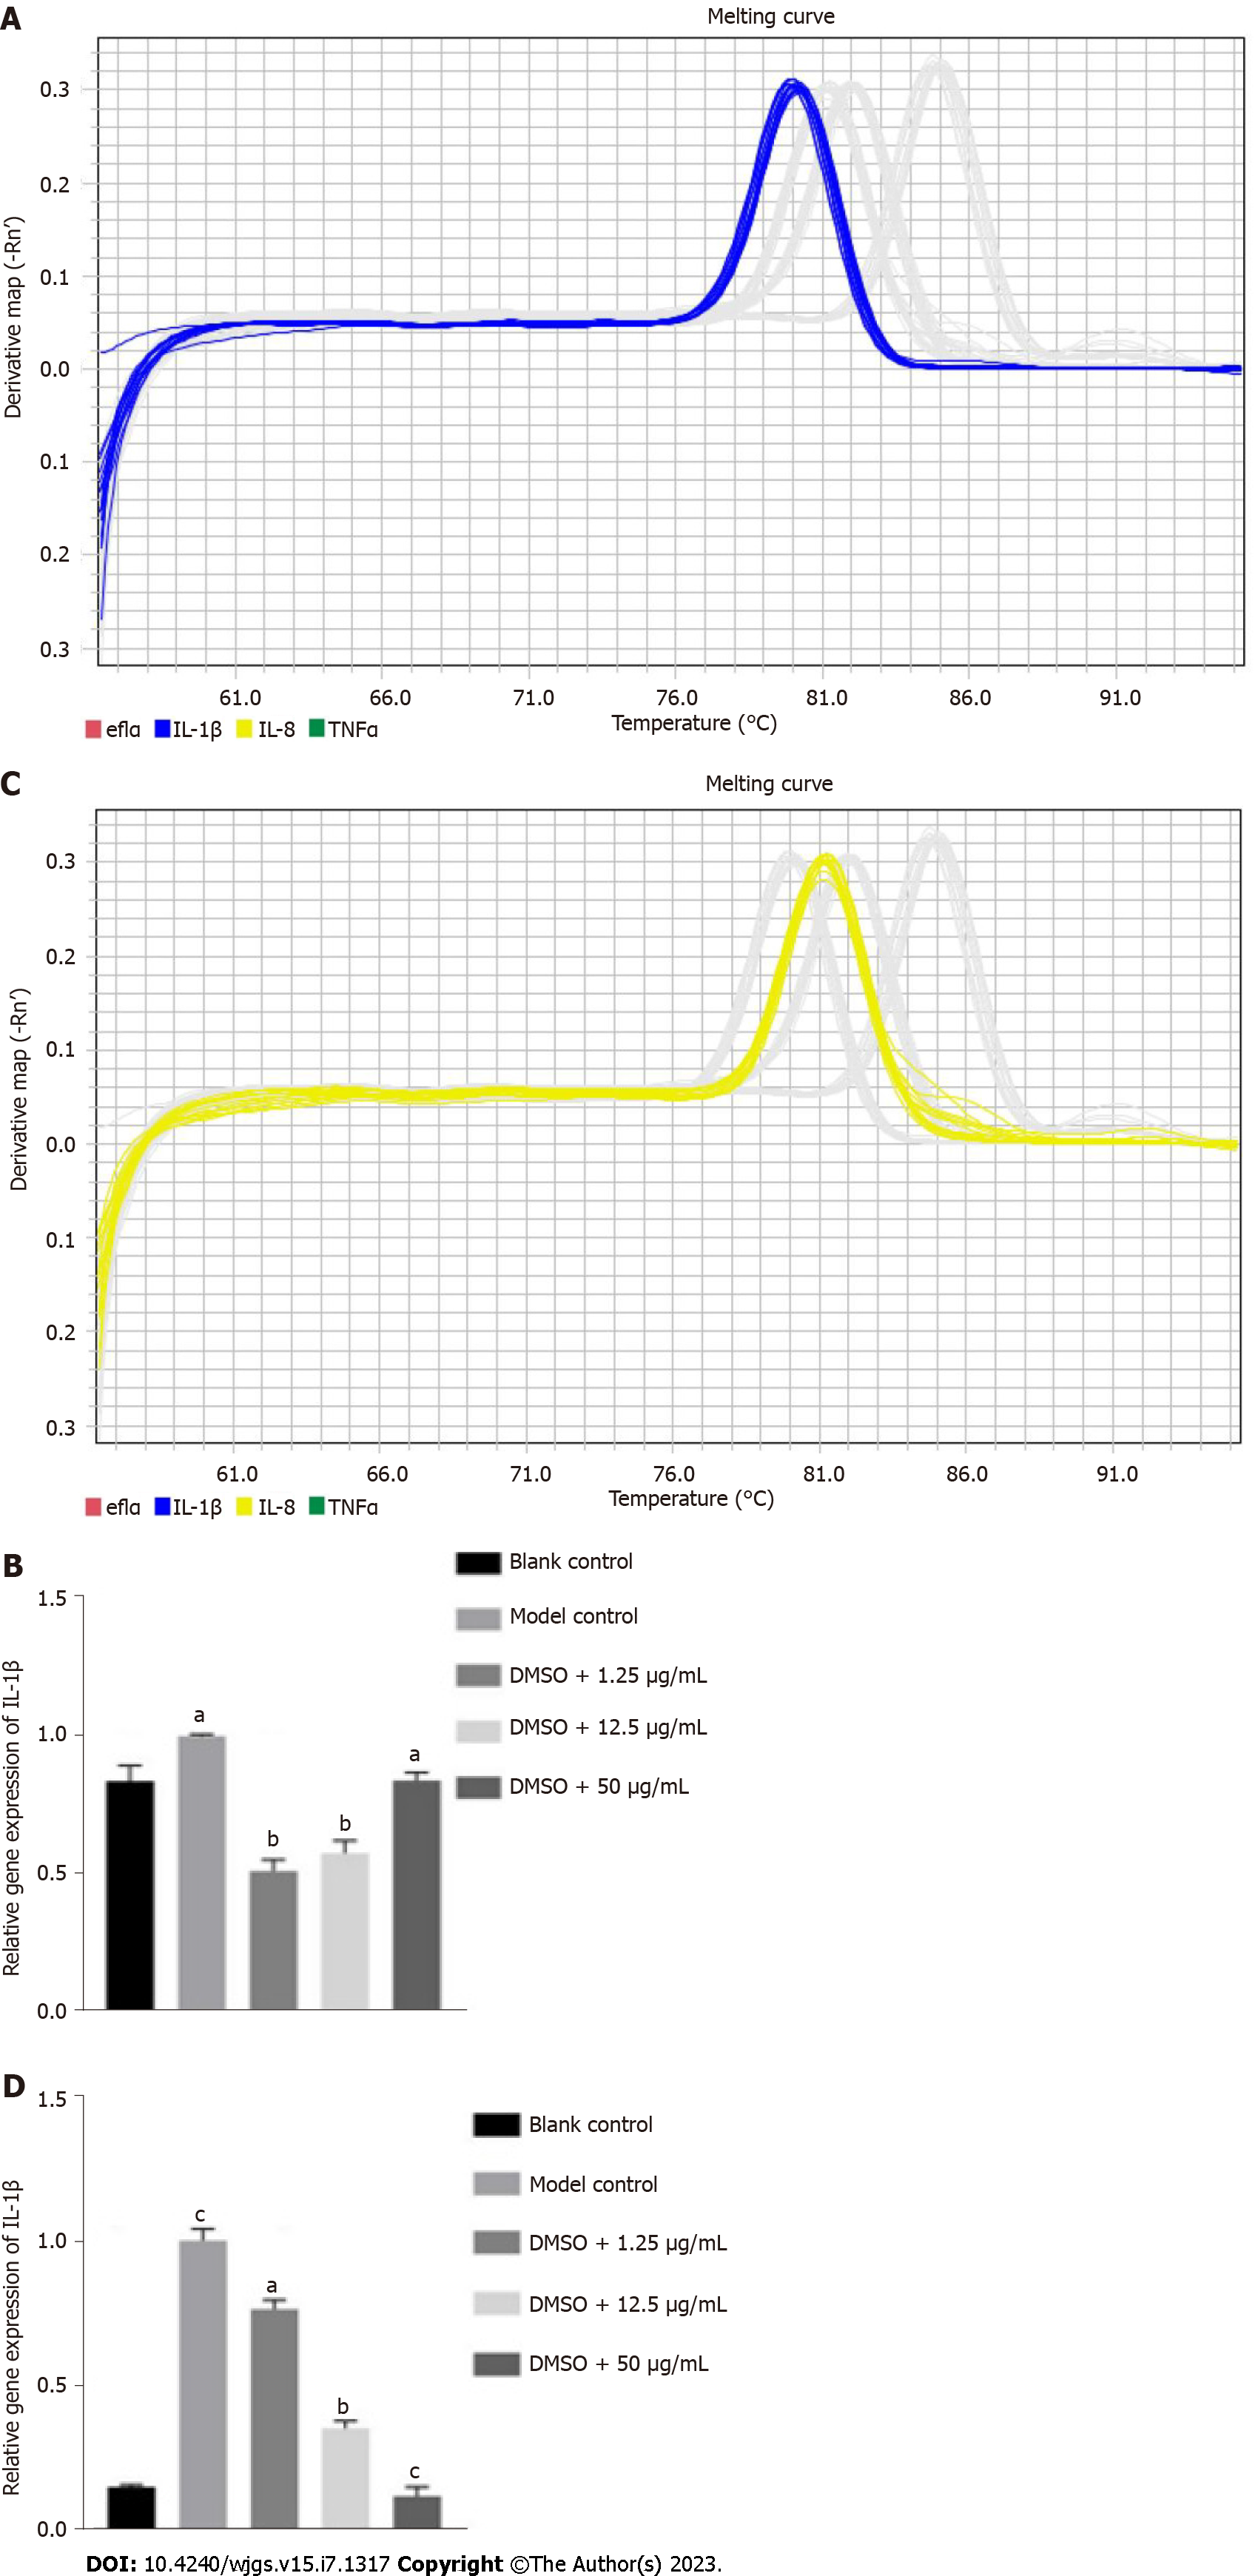
Figure 8 Gene expression detected by quantitative polymerase chain reaction after 3 d of glycyrrhizic acid administration.
A: Dissolution curve of interleukin (IL)-1β; B: Expression level of IL-1β; C: Dissolution curve of IL-8; D: Expression level of IL-8. aP < 0.05, compared with the blank control, compared with the model control; bP < 0.01, compared with the model control; cP < 0.001, compared with the blank control, compared with the model control. DMSO: Dimethyl sulfoxide; IL: Interleukin; TNF: Tumour necrosis factor.
- Citation: Liu MK, Chen YJ, Chen F, Lin ZX, Zhu ZC, Lin Y, Fang YF, Wu DM. Intervention effects and related mechanisms of glycyrrhizic acid on zebrafish with Hirschsprung-associated enterocolitis. World J Gastrointest Surg 2023; 15(7): 1317-1330
- URL: https://www.wjgnet.com/1948-9366/full/v15/i7/1317.htm
- DOI: https://dx.doi.org/10.4240/wjgs.v15.i7.1317


