Copyright
©The Author(s) 2023.
World J Gastrointest Surg. Jul 27, 2023; 15(7): 1304-1316
Published online Jul 27, 2023. doi: 10.4240/wjgs.v15.i7.1304
Published online Jul 27, 2023. doi: 10.4240/wjgs.v15.i7.1304
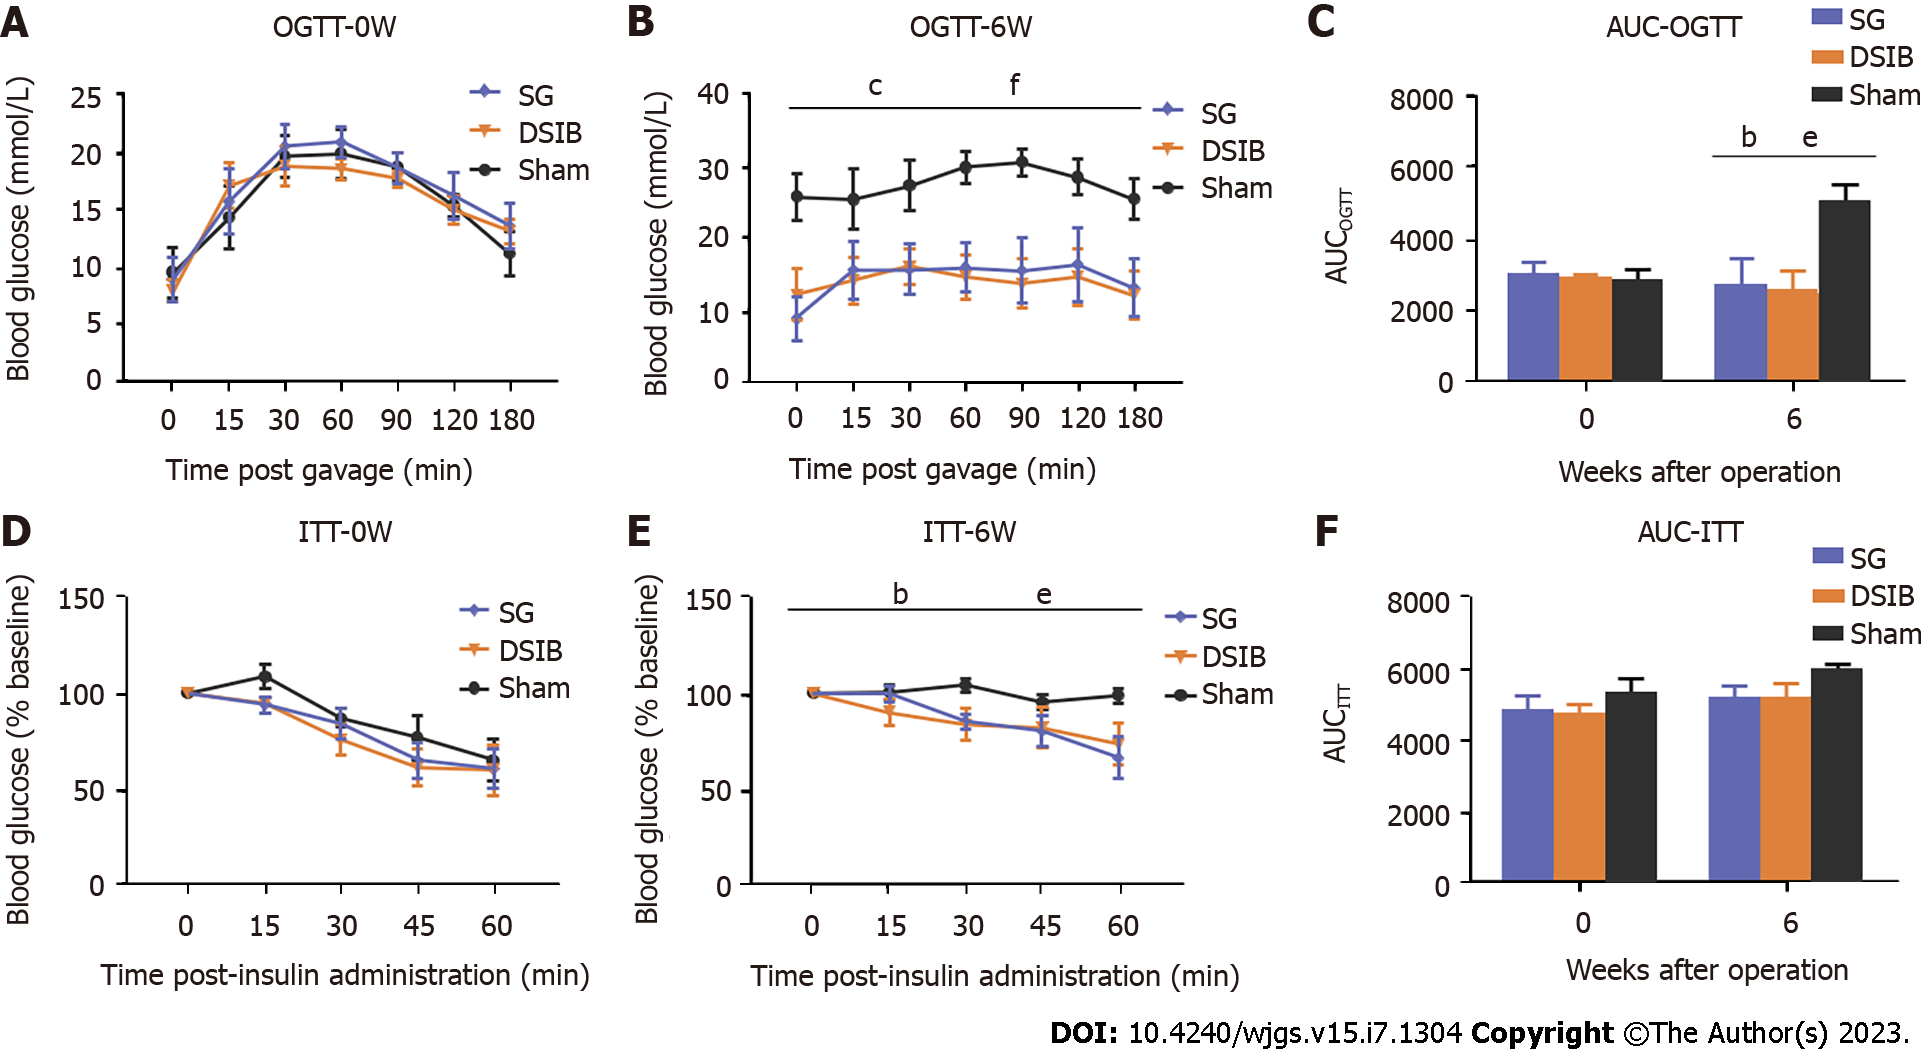
Figure 3 Postoperative improvement in glucose metabolism in rats.
A: Oral glucose tolerance test (OGTT) in rats at 0 wk; B: OGTT in rats at 6 wk postoperatively; C: Area under the curve of OGTT; D: Insulin sensitivity test (ITT) in rats at 0 wk; E: ITT in rats at 6 wk postoperatively; F: Area under the ITT curve. Data are presented as mean ± SEM. Statistical significance was determined by two-tailed Student’s t-test or two-way analysis of variance, sleeve gastrectomy (SG) vs sham P value magnitude, aP < 0.05, bP < 0.01, cP < 0.001; distal small bowel bypass (DSIB) vs sham group P value magnitude, & DSIB vs SG P value magnitude, dP < 0.05, eP < 0.01, fP < 0.001. AUC: Area under the curve; ITT: Insulin tolerance test; OGTT: Oral glucose tolerance test.
- Citation: Luo X, Tan C, Tao F, Xu CY, Zheng ZH, Pang Q, He XA, Cao JQ, Duan JY. Differences in metabolic improvement after metabolic surgery are linked to the gut microbiota in non-obese diabetic rats. World J Gastrointest Surg 2023; 15(7): 1304-1316
- URL: https://www.wjgnet.com/1948-9366/full/v15/i7/1304.htm
- DOI: https://dx.doi.org/10.4240/wjgs.v15.i7.1304


