Copyright
©The Author(s) 2023.
World J Gastrointest Surg. May 27, 2023; 15(5): 892-905
Published online May 27, 2023. doi: 10.4240/wjgs.v15.i5.892
Published online May 27, 2023. doi: 10.4240/wjgs.v15.i5.892
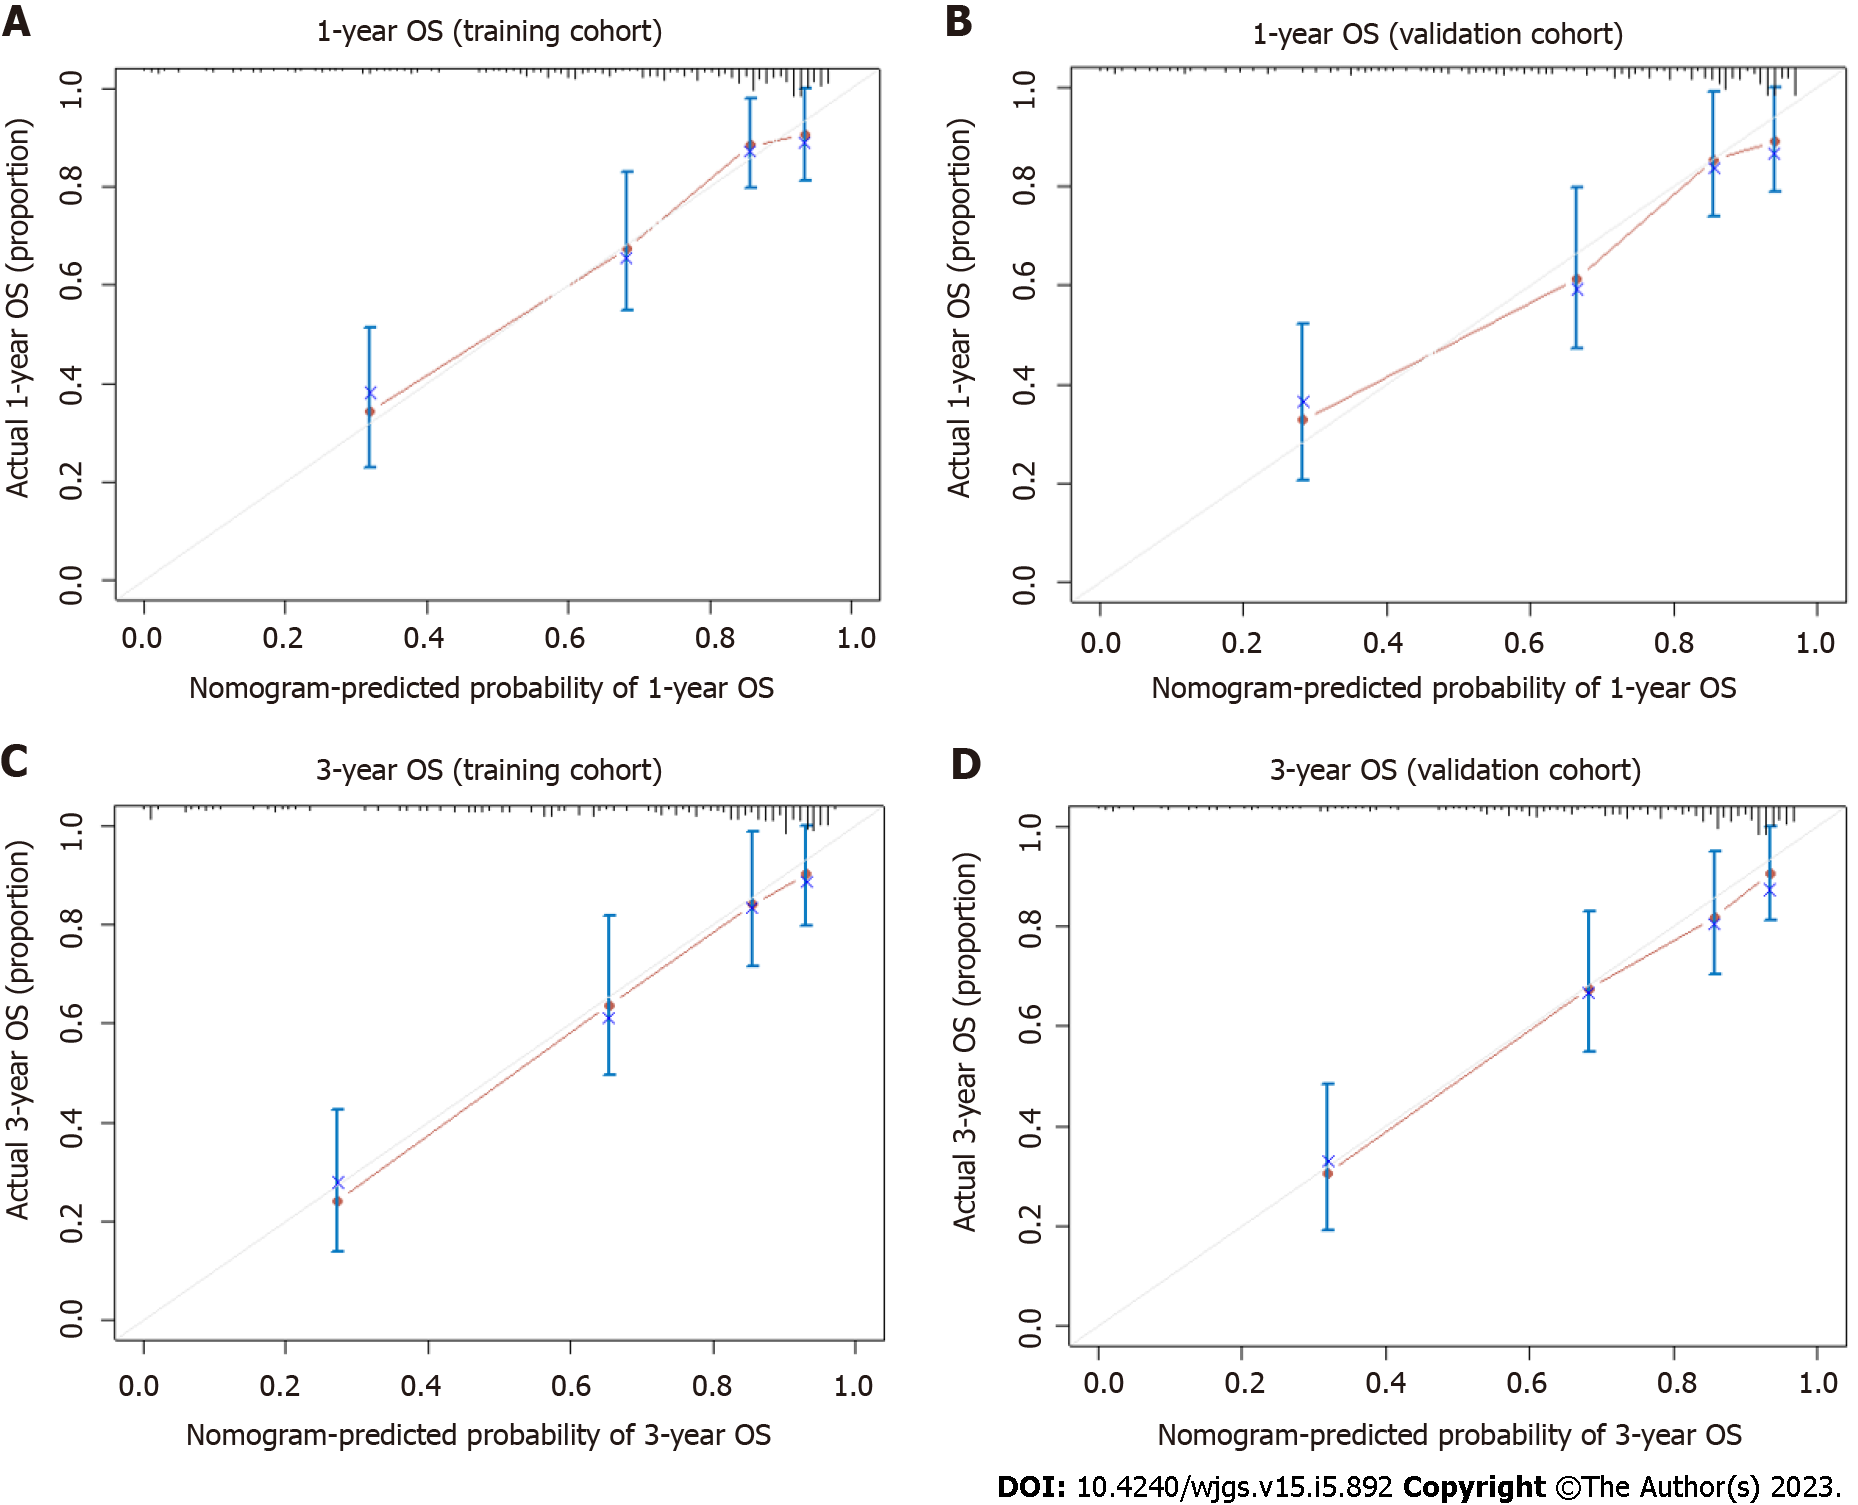
Figure 4 Calibration curves of 1- and 3-yr overall survival for elderly colorectal cancer patients.
A: 1-yr overall survival (OS) of the training cohort; B: 1-yr OS of the validation cohort; C: 3-yr OS of the training cohort; D: 3-yr OS of the validation cohort. The grey line represented the optimal reference line where the predicted survival probability corresponded to the observed OS rates. The red dots obtained by bootstrapping (re-sample size: 1000) represented the performance of the constructed nomogram. The greater the proximity of the solid red line to the grey line, the more precisely the nomogram model predicted the OS probability. OS: Overall survival.
- Citation: Chok AY, Zhao Y, Chen HLR, Tan IEH, Chew DHW, Zhao Y, Au MKH, Tan EJKW. Elderly patients over 80 years undergoing colorectal cancer resection: Development and validation of a predictive nomogram for survival. World J Gastrointest Surg 2023; 15(5): 892-905
- URL: https://www.wjgnet.com/1948-9366/full/v15/i5/892.htm
- DOI: https://dx.doi.org/10.4240/wjgs.v15.i5.892


