Copyright
©The Author(s) 2023.
World J Gastrointest Surg. May 27, 2023; 15(5): 812-824
Published online May 27, 2023. doi: 10.4240/wjgs.v15.i5.812
Published online May 27, 2023. doi: 10.4240/wjgs.v15.i5.812
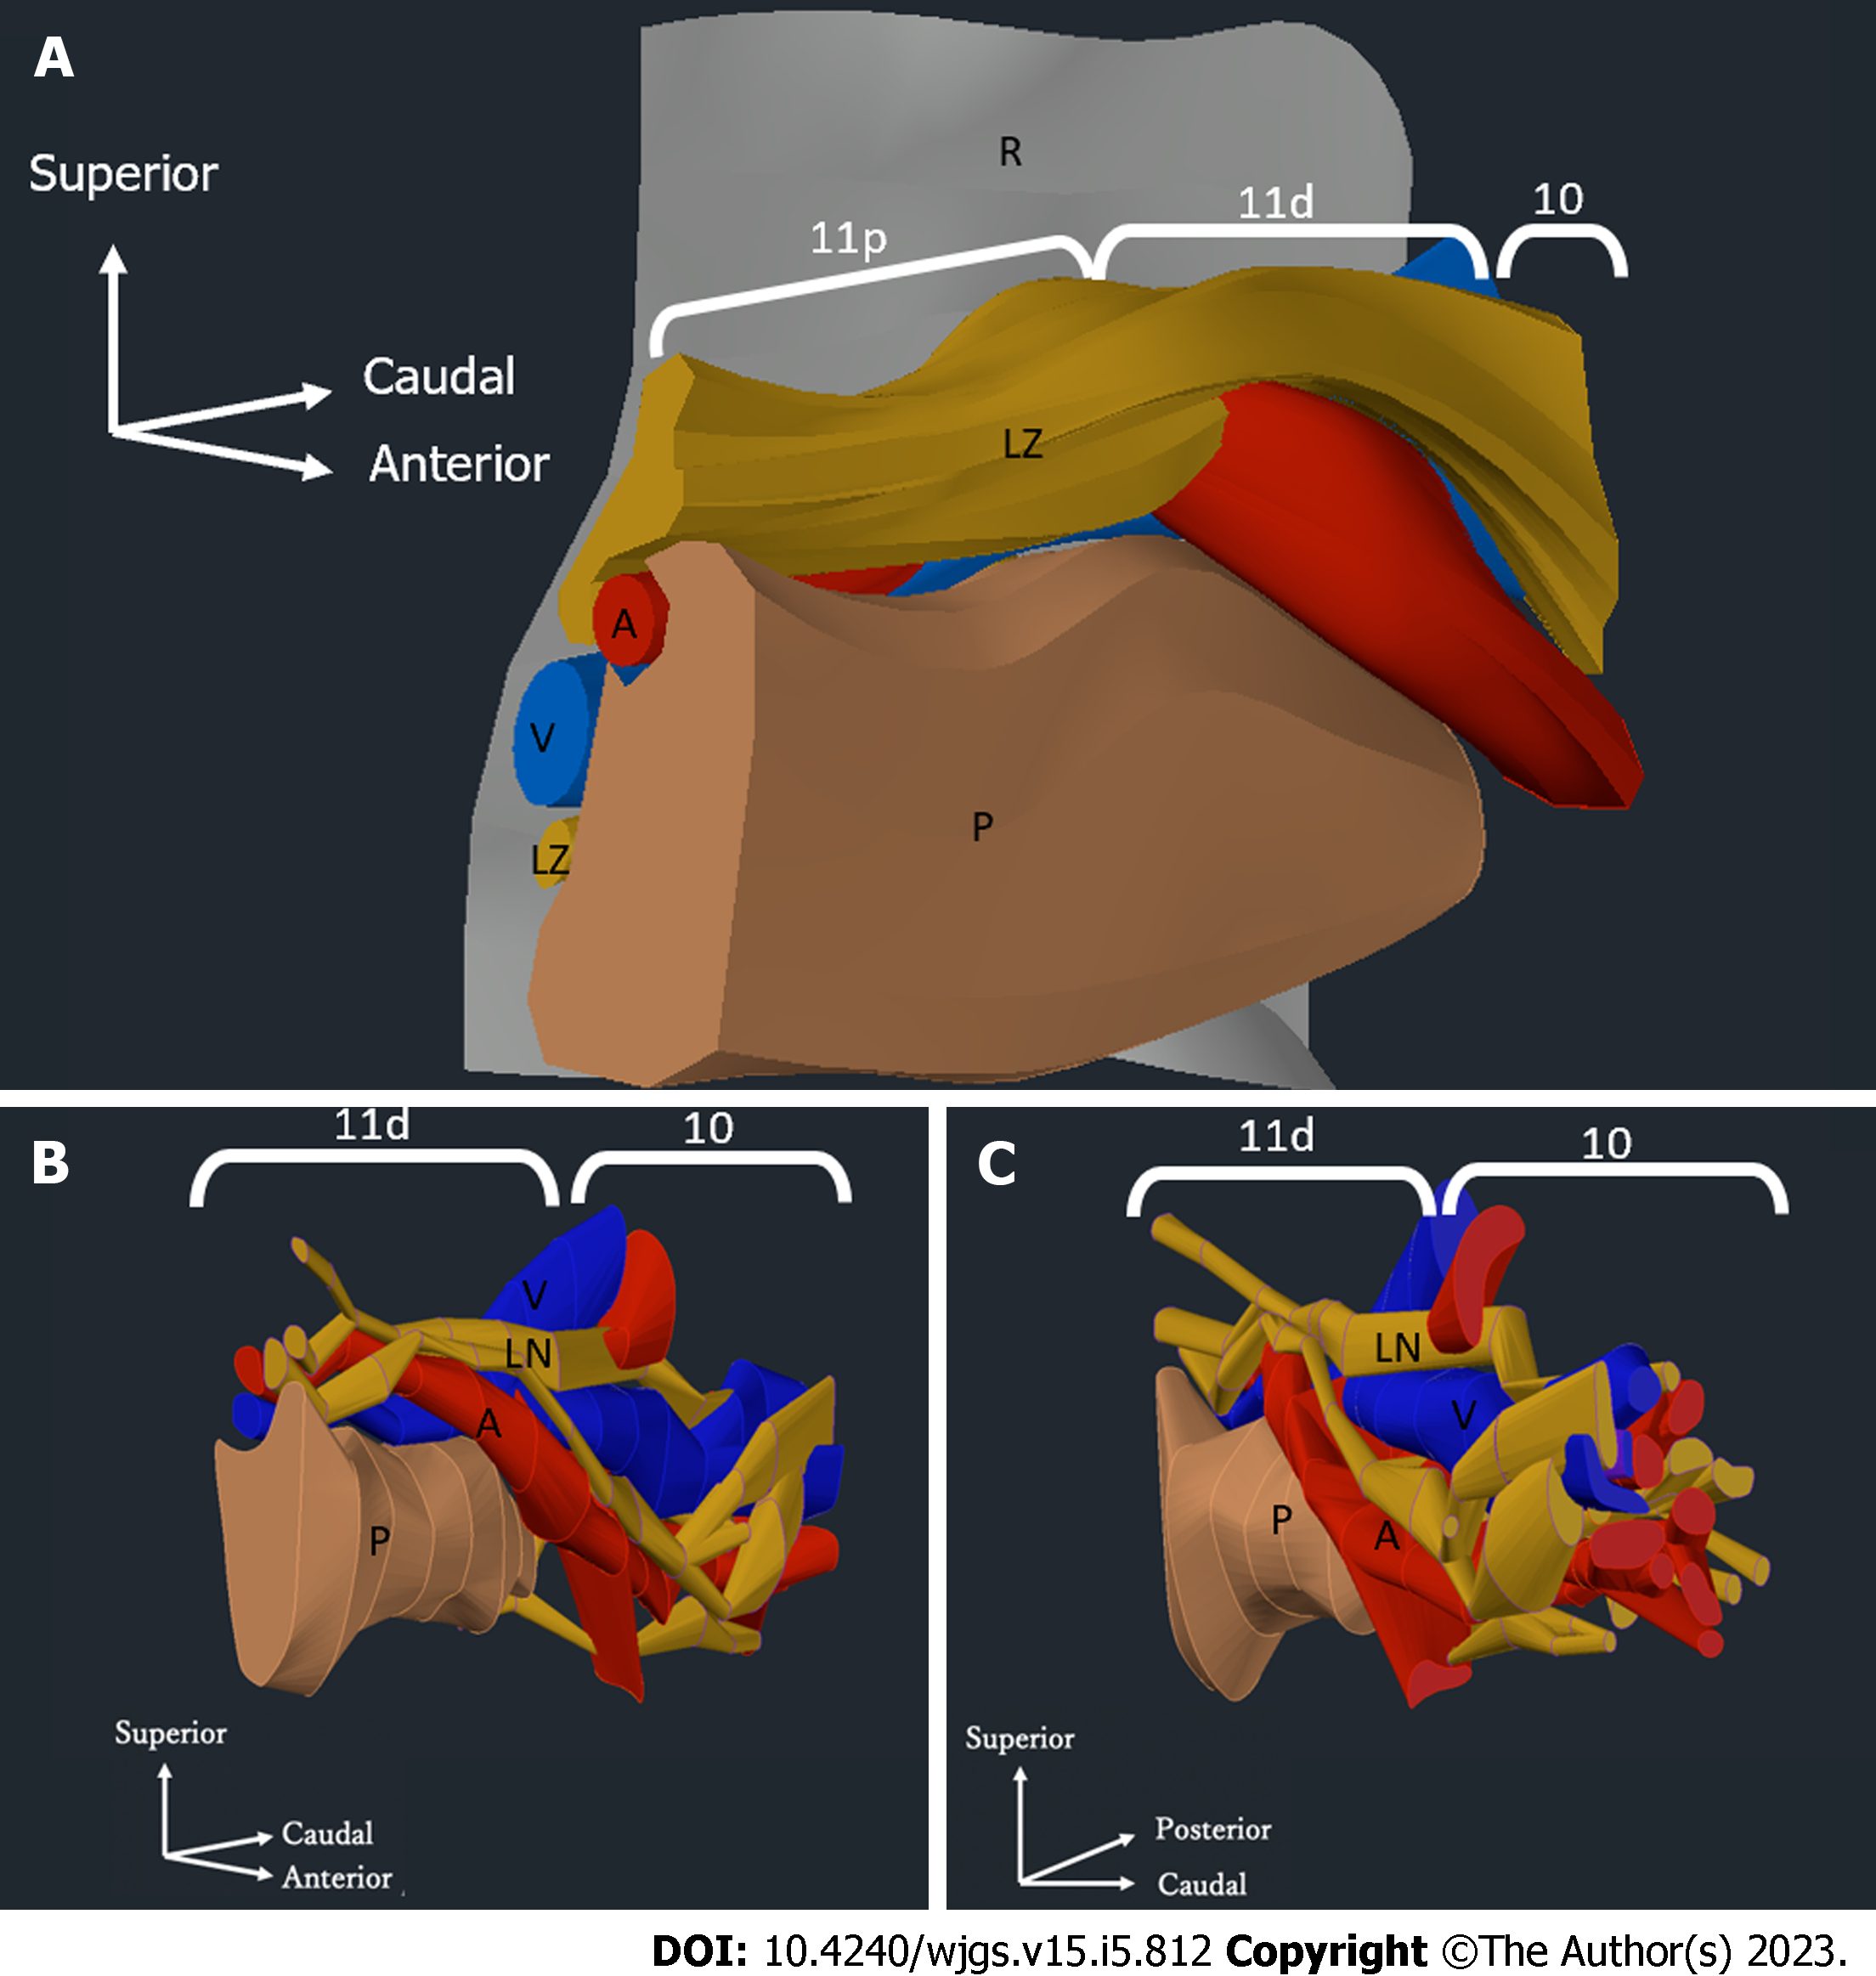
Figure 7 Three-dimensional model of the distribution of the pancreas, splenic artery, splenic vein, and lymph nodes.
Three-dimensional model of the distribution of the pancreas, splenic artery, splenic vein, and lymph nodes (LNs). A: Three-dimensional model of the distribution of the pancreatic parenchyma, splenic artery, splenic vein, and LNs in the No. 11 region in case 2. The yellow zones represent the areas that contain LNs and surrounding tissues; B and C: Three-dimensional model showing the distribution of the pancreatic parenchyma, splenic artery, splenic vein, and LNs in the region of LN No. 11p and LN No. 10 in case 2. The yellow zones represent the LNs. Three-dimensional model viewed from the pancreatic head toward the splenic hilum. The retroperitoneal side is on the left (B). Three-dimensional model of the splenic hilum looking toward the pancreatic head. The retroperitoneal side is on the right (C). Brown: Pancreatic parenchyma; Red: Splenic artery; Blue: Splenic vein; Yellow: Lymph nodes; Gray: Border with the retroperitoneum; R: Retroperitoneal; LZ: Lymph node zone; A: Splenic artery; V: Splenic vein; P: Pancreas; LN: Lymph node; 11p: No. 11p lymph node; 11d: No. 11d lymph node; 10: No. 10 lymph node.
- Citation: Umebayashi Y, Muro S, Tokunaga M, Saito T, Sato Y, Tanioka T, Kinugasa Y, Akita K. Distribution of splenic artery lymph nodes and splenic hilar lymph nodes. World J Gastrointest Surg 2023; 15(5): 812-824
- URL: https://www.wjgnet.com/1948-9366/full/v15/i5/812.htm
- DOI: https://dx.doi.org/10.4240/wjgs.v15.i5.812


