Copyright
©The Author(s) 2023.
World J Gastrointest Surg. May 27, 2023; 15(5): 812-824
Published online May 27, 2023. doi: 10.4240/wjgs.v15.i5.812
Published online May 27, 2023. doi: 10.4240/wjgs.v15.i5.812
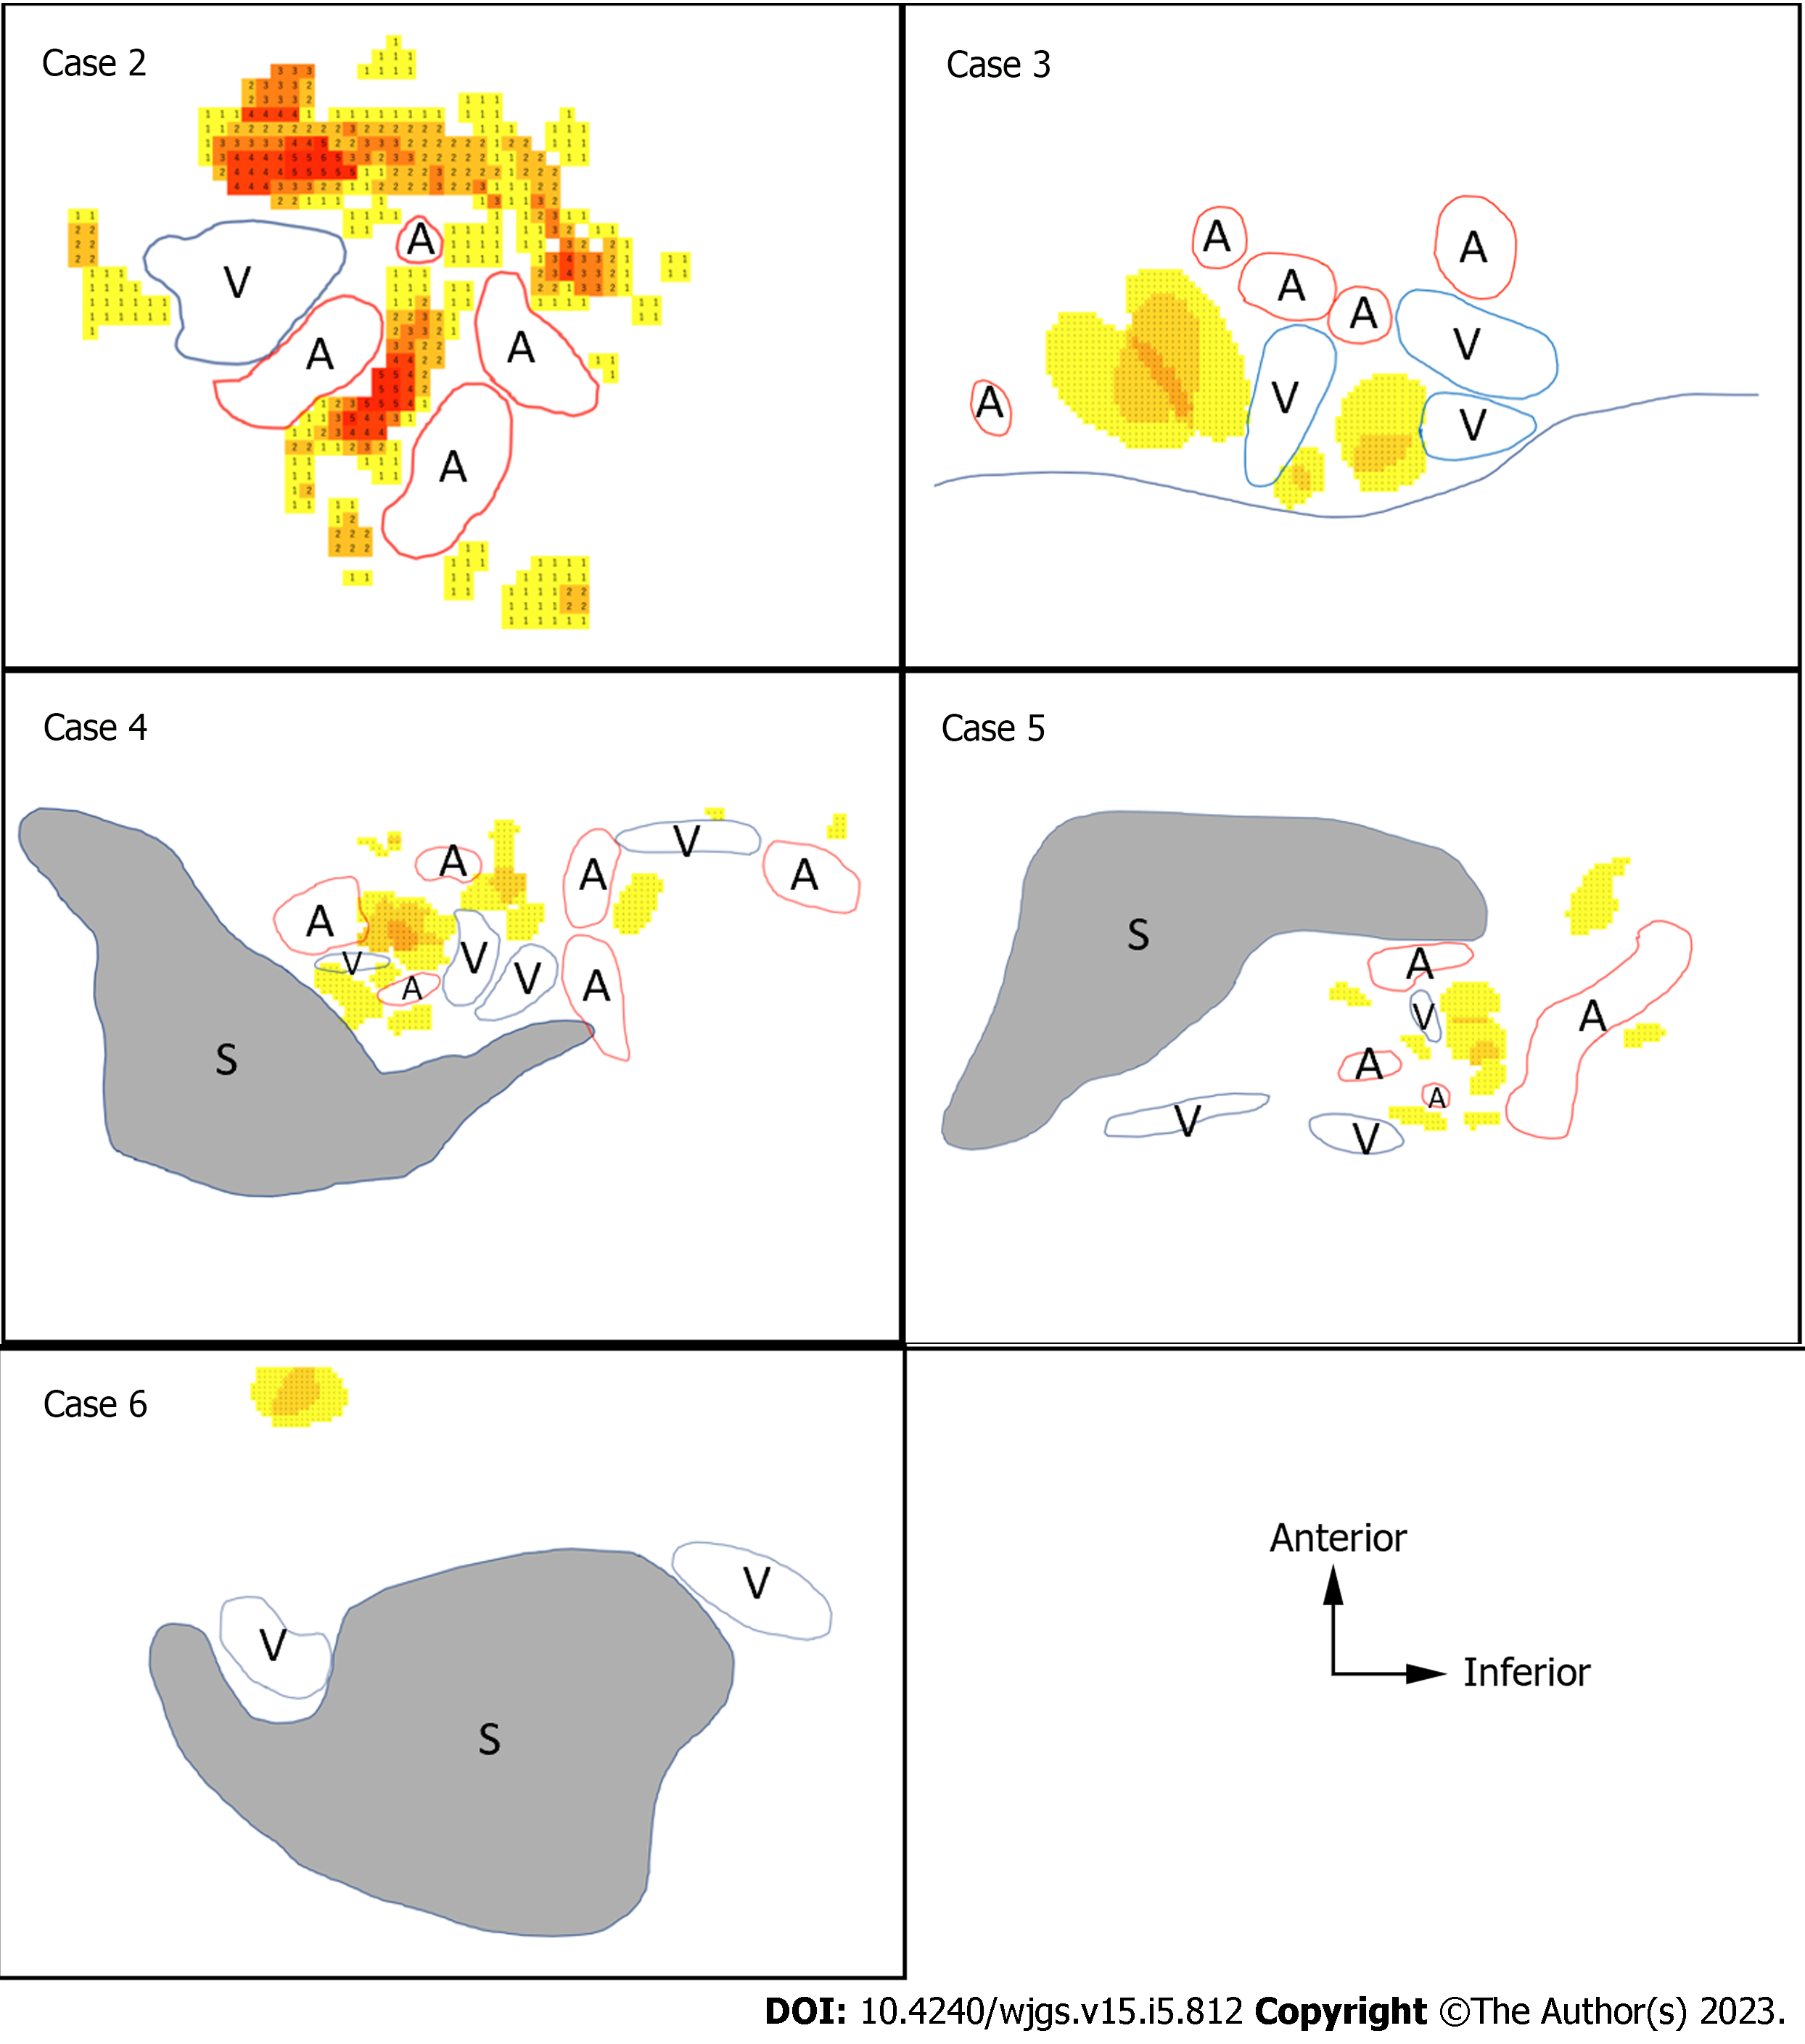
Figure 5 Heatmaps of the splenic hilum region.
Heatmaps of the splenic hilum region. Heatmaps of the five cadavers studied for the splenic hilum utilizing the color scale of Microsoft Excel for Mac (version 16.16.27[202012]). The scale is set to show that the number of lymph nodes (LNs) increases as the color changes from yellow to red. The colored cells with numbers are LN heatmaps. A: Splenic artery; V: Splenic vein; S: Spleen; LN: Lymph node.
- Citation: Umebayashi Y, Muro S, Tokunaga M, Saito T, Sato Y, Tanioka T, Kinugasa Y, Akita K. Distribution of splenic artery lymph nodes and splenic hilar lymph nodes. World J Gastrointest Surg 2023; 15(5): 812-824
- URL: https://www.wjgnet.com/1948-9366/full/v15/i5/812.htm
- DOI: https://dx.doi.org/10.4240/wjgs.v15.i5.812


