Copyright
©The Author(s) 2023.
World J Gastrointest Surg. May 27, 2023; 15(5): 812-824
Published online May 27, 2023. doi: 10.4240/wjgs.v15.i5.812
Published online May 27, 2023. doi: 10.4240/wjgs.v15.i5.812
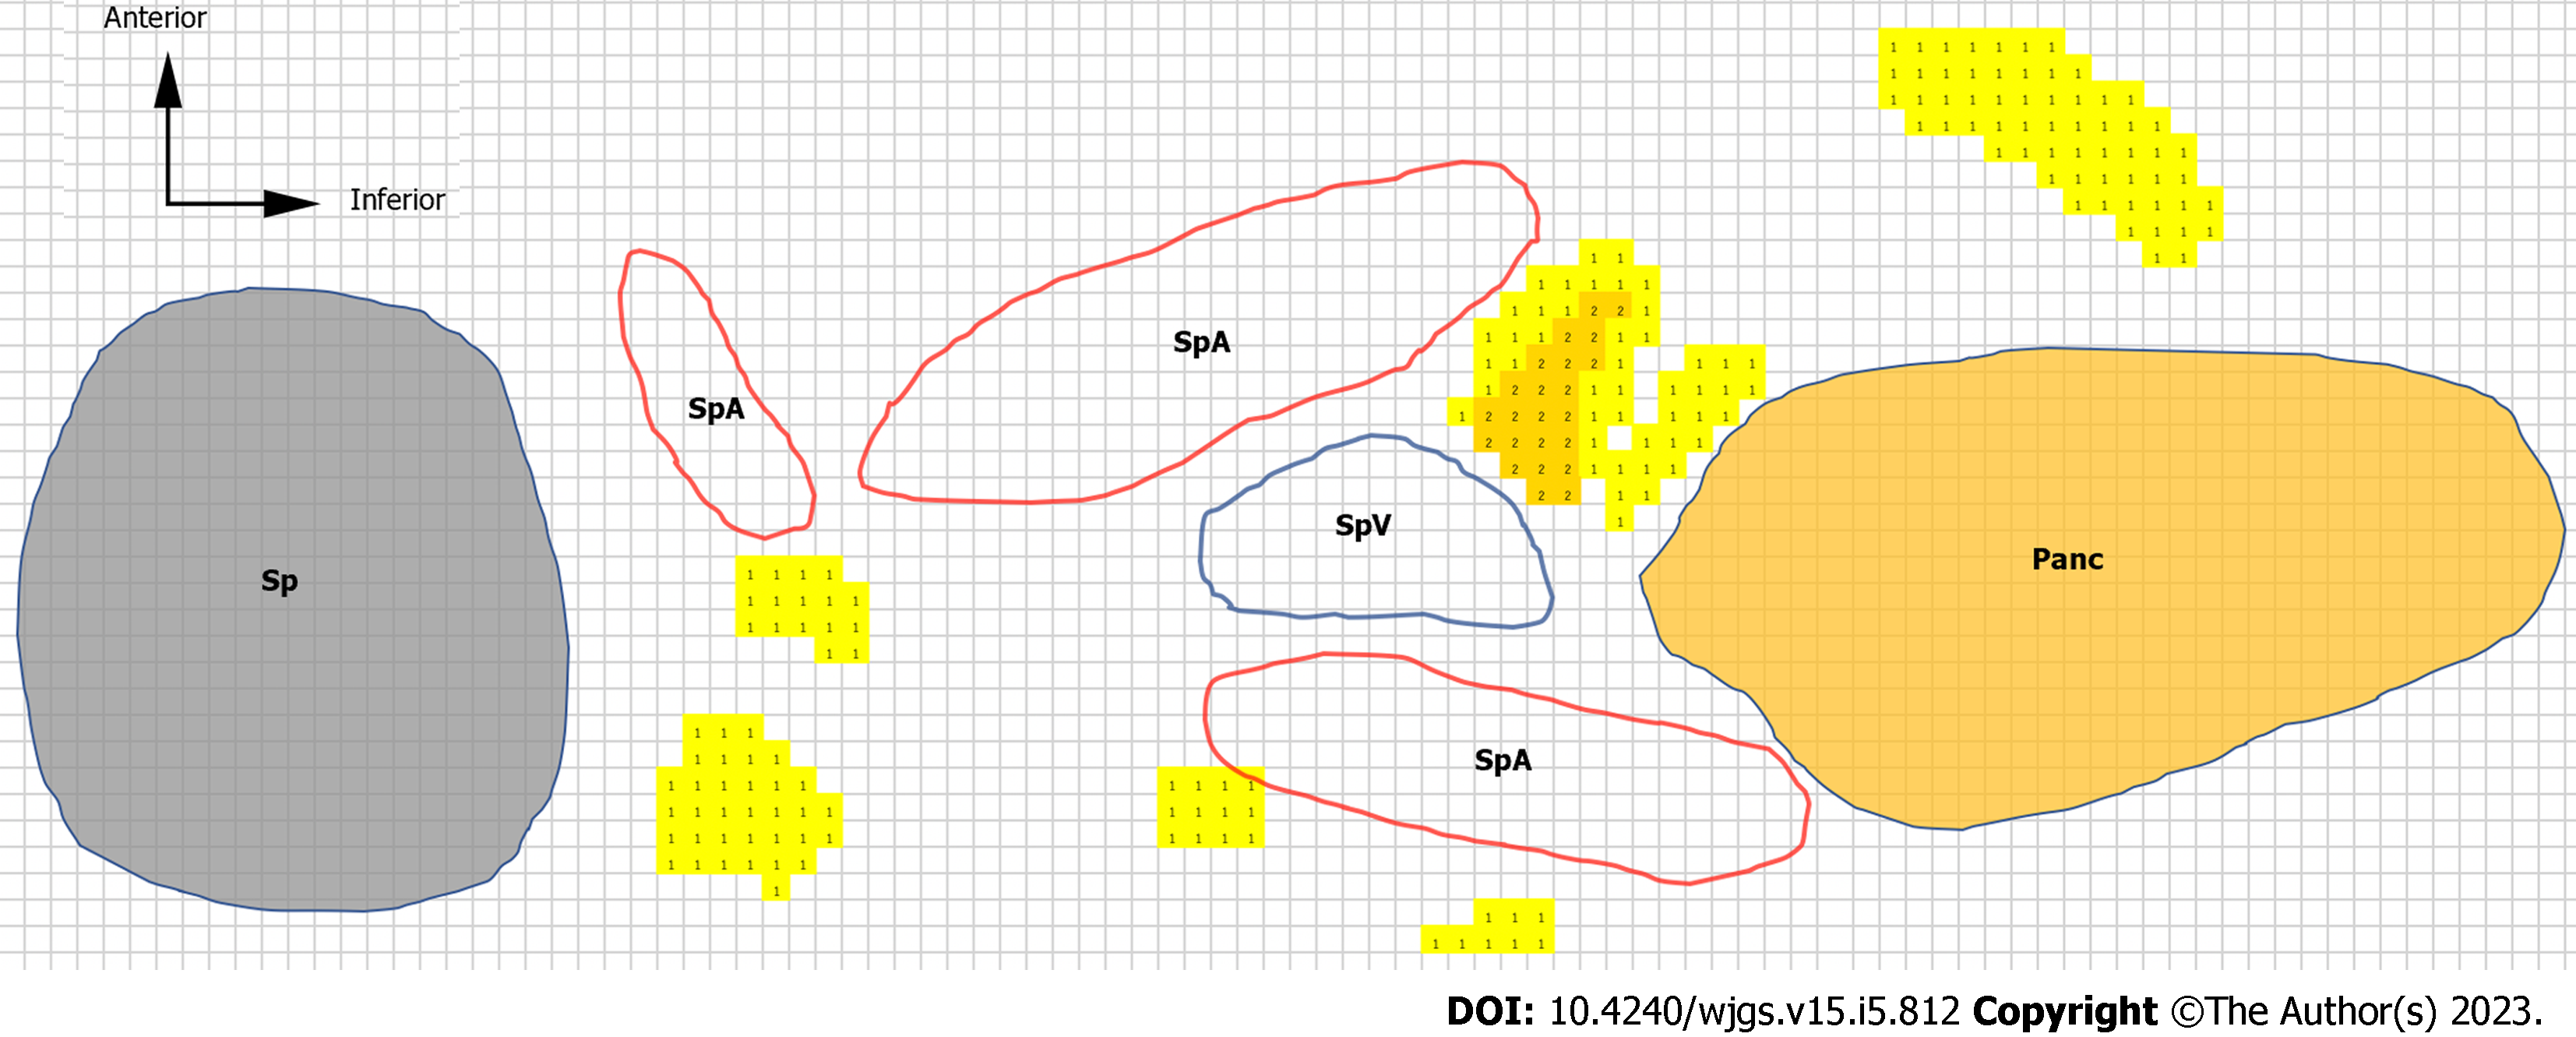
Figure 3 Heatmap and color scale.
We traced the major structures [i.e., pancreatic parenchyma, spleen, splenic artery, splenic vein, and lymph nodes (LNs)] around the No. 11d LN region in case 4. The number of LNs is represented as a heatmap. We made the heatmap using the color scale function of Microsoft Excel for Mac (version 16.16.27[202012]). The scale is set to show that the number of LNs increases as the color changes from yellow to red. The colored cells with numbers are LN heatmaps. LN: Lymph node; Sp: Spleen; Panc: Pancreas; SpA: Splenic artery; SpV: Splenic vein.
- Citation: Umebayashi Y, Muro S, Tokunaga M, Saito T, Sato Y, Tanioka T, Kinugasa Y, Akita K. Distribution of splenic artery lymph nodes and splenic hilar lymph nodes. World J Gastrointest Surg 2023; 15(5): 812-824
- URL: https://www.wjgnet.com/1948-9366/full/v15/i5/812.htm
- DOI: https://dx.doi.org/10.4240/wjgs.v15.i5.812


