Copyright
©The Author(s) 2023.
World J Gastrointest Surg. Apr 27, 2023; 15(4): 723-739
Published online Apr 27, 2023. doi: 10.4240/wjgs.v15.i4.723
Published online Apr 27, 2023. doi: 10.4240/wjgs.v15.i4.723
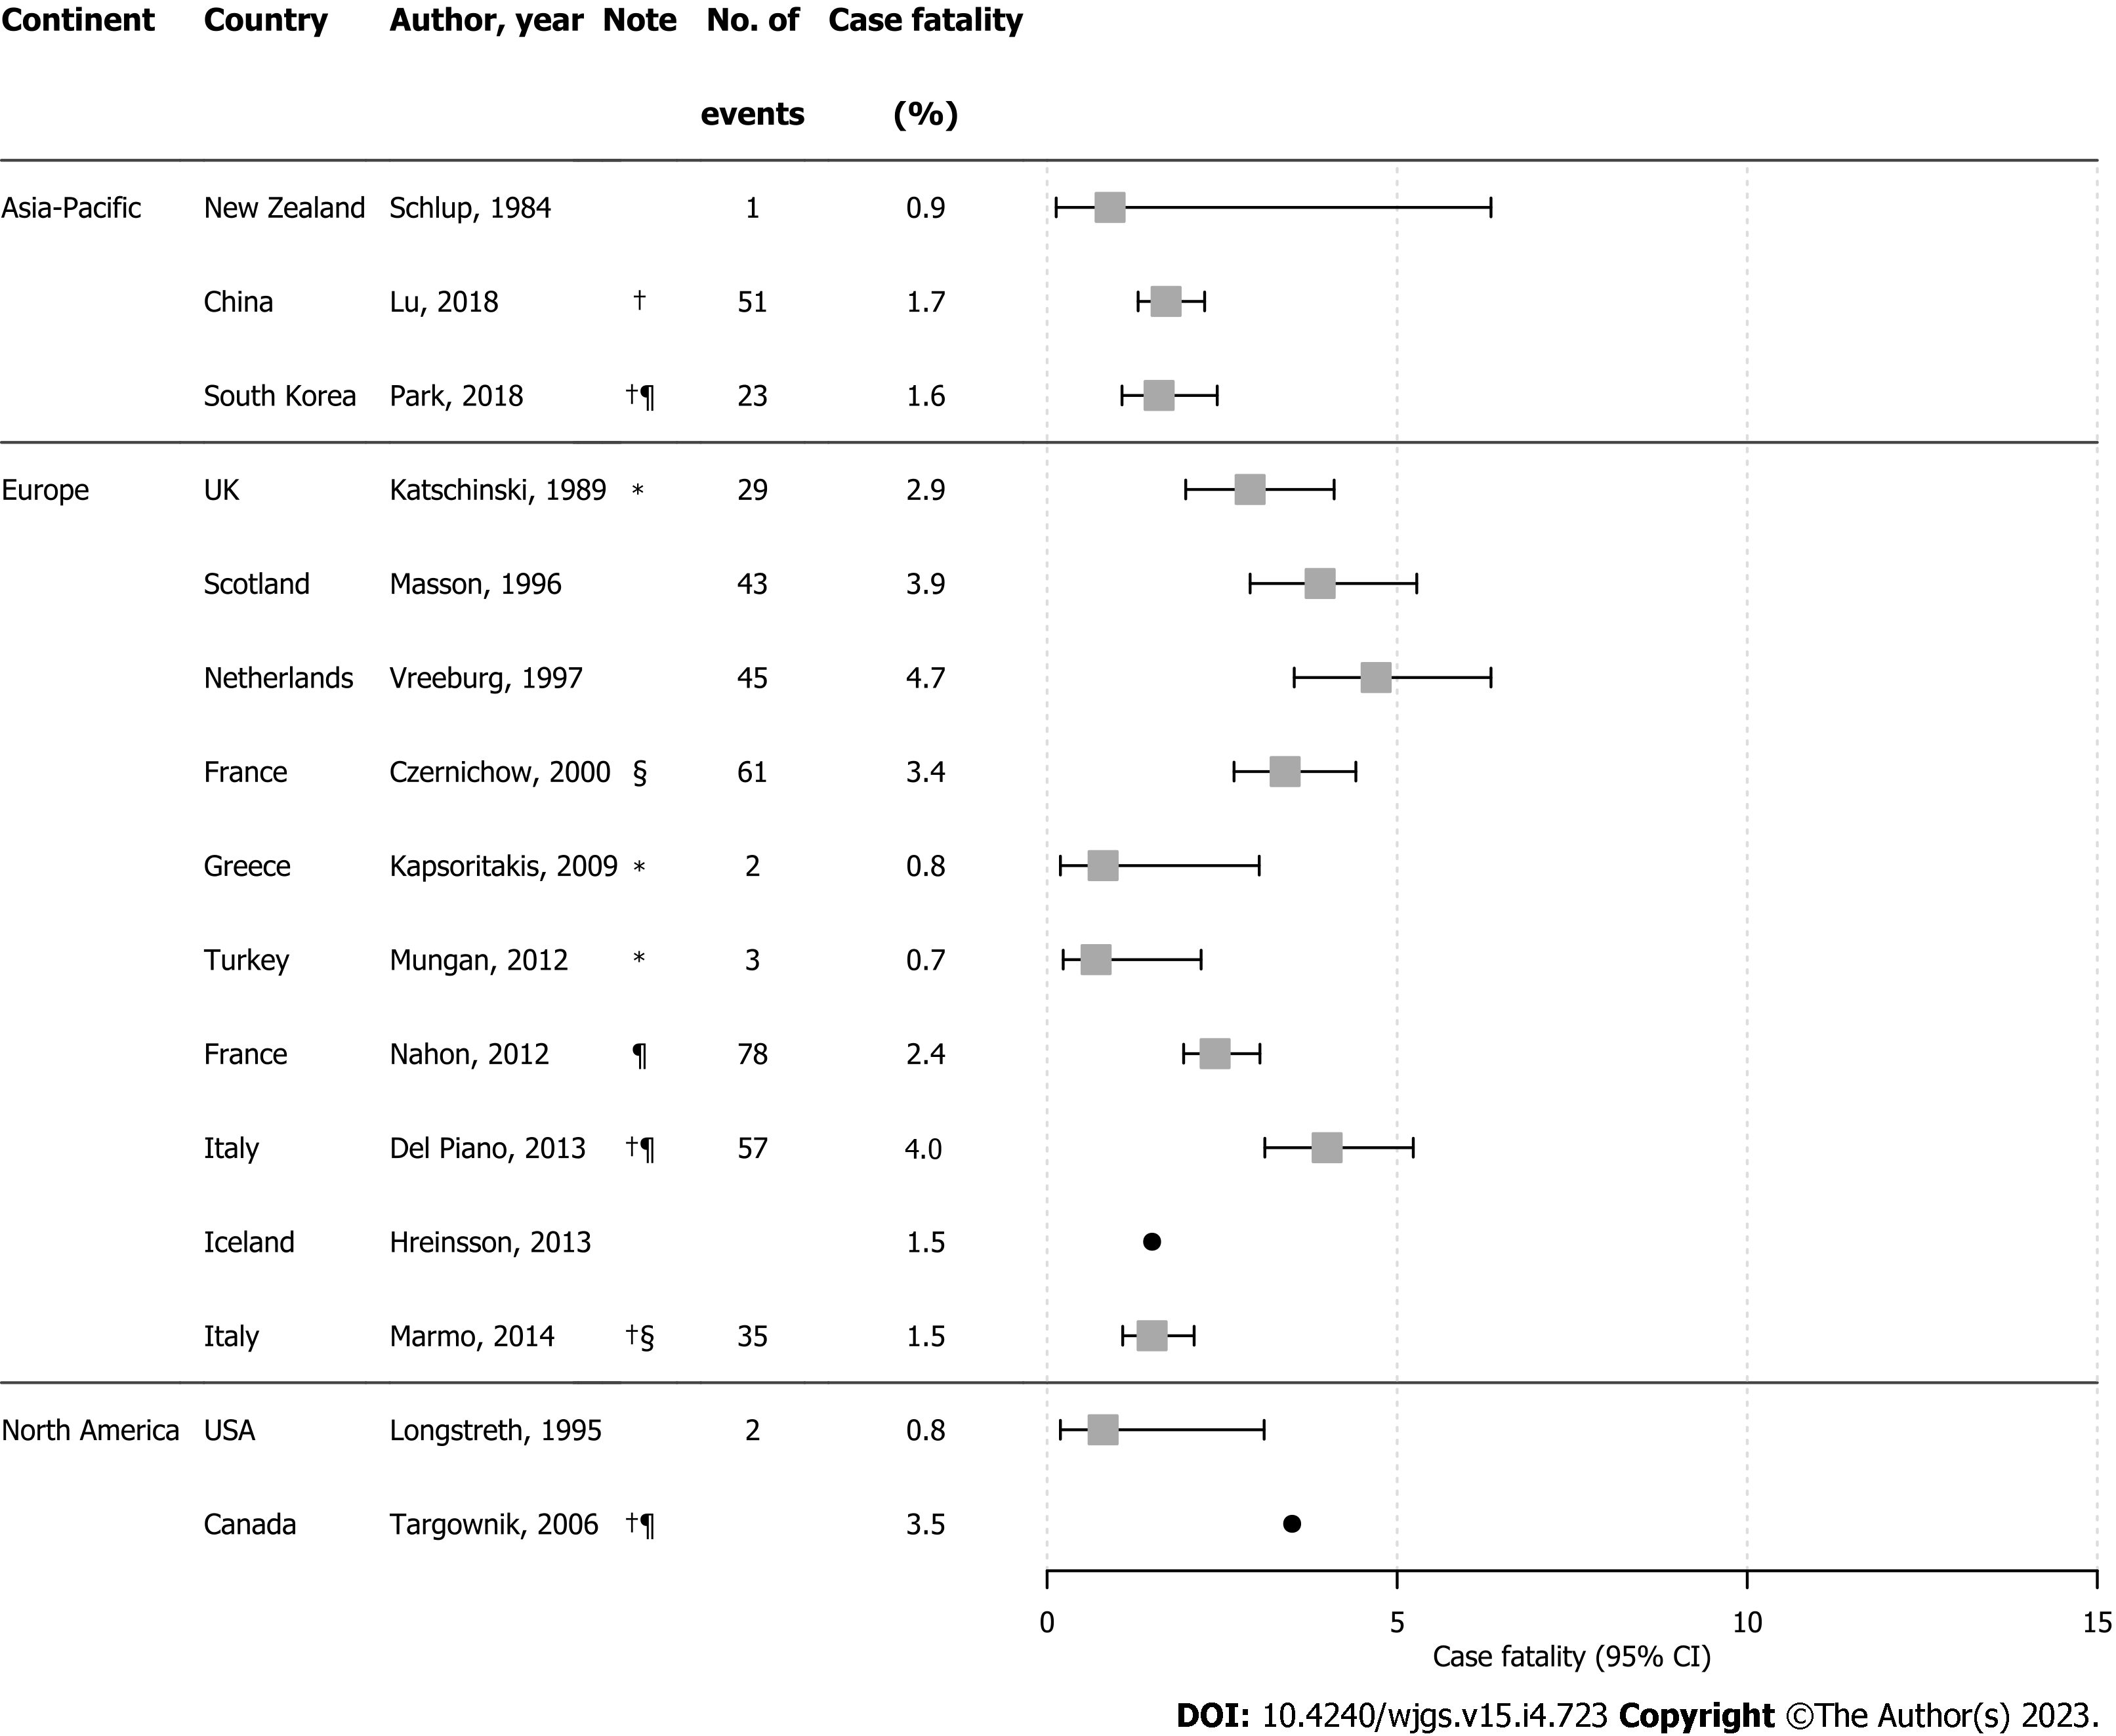
Figure 4 Forest plot of upper gastrointestinal bleeding case-fatality rates.
This figure displays case-fatality rates of upper gastrointestinal bleeding, with 95% confidence intervals (when reported) from studies included in the review that reported this information. Estimates were marked as a point without 95%CI, when denominator was missing. *Calculated from the available data (not originally presented in the paper). †NVUGIB. ‡Calculated from hospitalizations (not the number of patients). §Included out-patient bleeds. ¶Included UGIB cases only if primary diagnosis. CI: Confidence interval; NVUGIB: Non-variceal upper gastrointestinal bleeding; UGIB: Upper gastrointestinal bleeding; USA: United States of America.
- Citation: Saydam ŞS, Molnar M, Vora P. The global epidemiology of upper and lower gastrointestinal bleeding in general population: A systematic review. World J Gastrointest Surg 2023; 15(4): 723-739
- URL: https://www.wjgnet.com/1948-9366/full/v15/i4/723.htm
- DOI: https://dx.doi.org/10.4240/wjgs.v15.i4.723


