Copyright
©The Author(s) 2023.
World J Gastrointest Surg. Apr 27, 2023; 15(4): 664-673
Published online Apr 27, 2023. doi: 10.4240/wjgs.v15.i4.664
Published online Apr 27, 2023. doi: 10.4240/wjgs.v15.i4.664
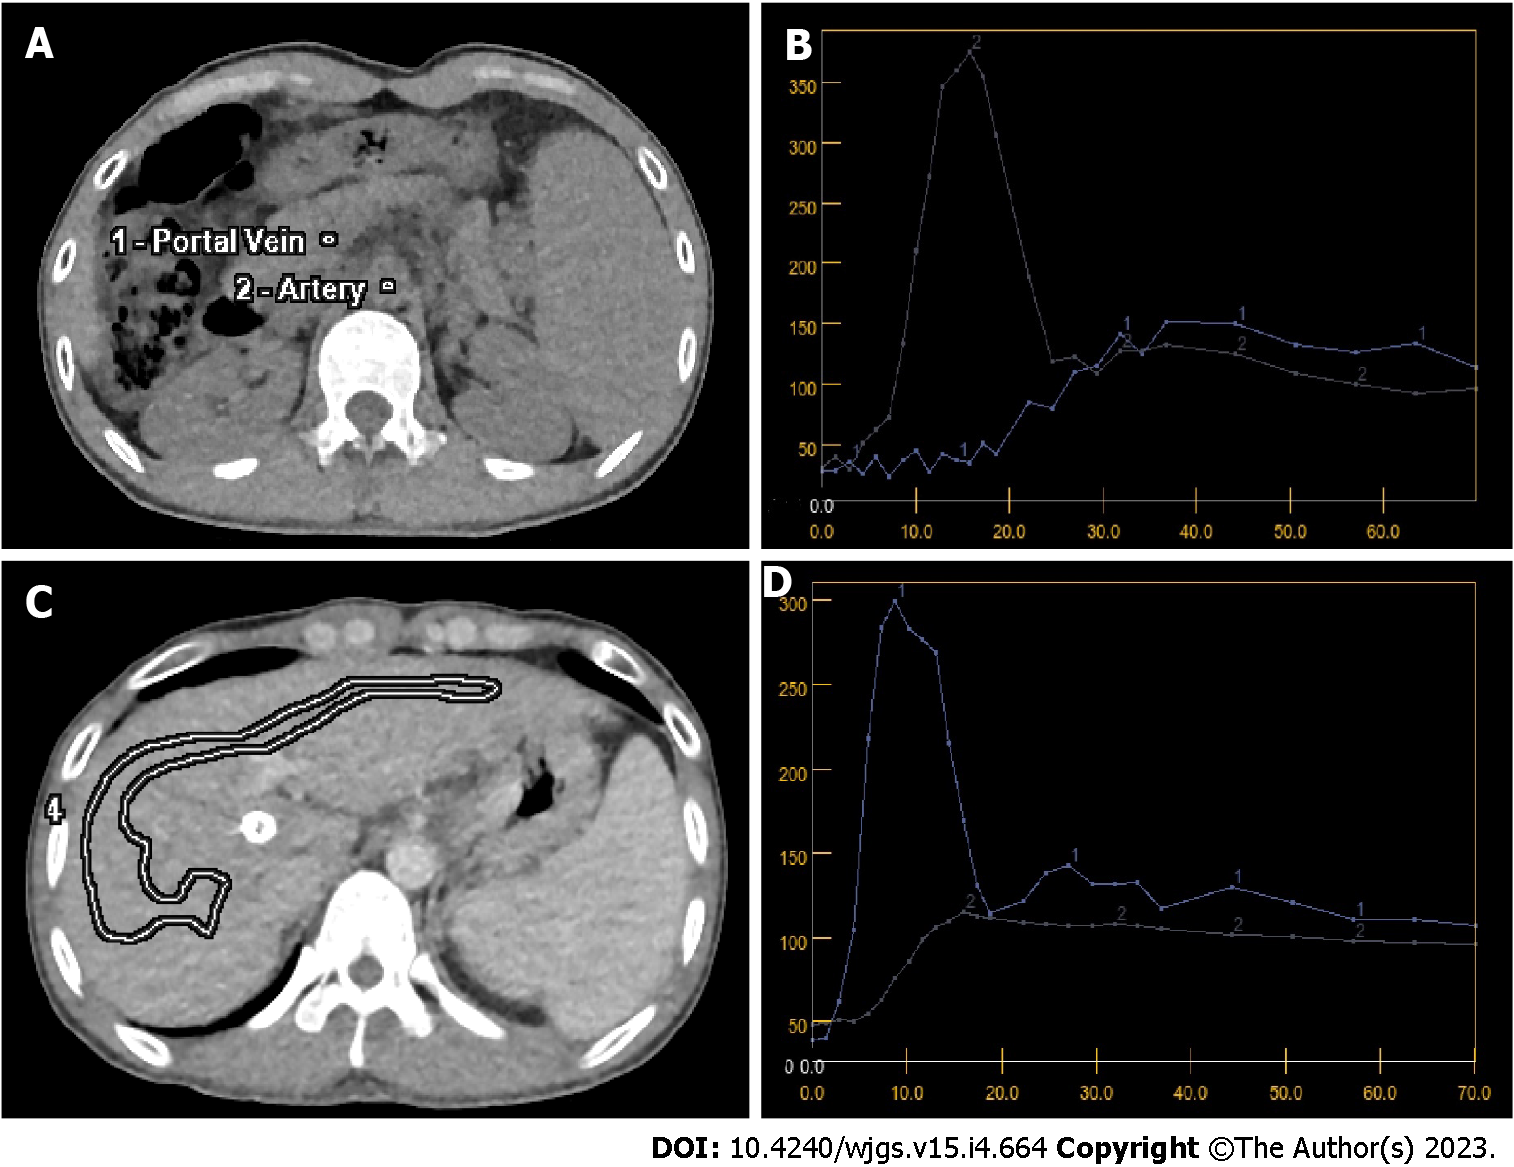
Figure 1 Baseline of computed tomography maps and time density curves before and after transjugular intrahepatic portosystemic shunt.
A: Baseline of computed tomography (CT) map with regions of interests for input arterial abdominal artery and portal vein before transjugular intrahepatic portosystemic shunt (TIPS); B: Time-density curve of CT perfusion before TIPS, and axis X is time axis with unit of second, while axis Y is density axis with unit of Hounsfield; C: Region of interest in liver parenchyma for perfusion parameters after TIPS; D: Time-density curve of CT perfusion after TIPS, and axis X is time axis with unit of second, while axis Y is density axis with unit of Hounsfield.
- Citation: Dong J, Zhang Y, Wu YF, Yue ZD, Fan ZH, Zhang CY, Liu FQ, Wang L. Computed tomography perfusion in differentiating portal hypertension: A correlation study with hepatic venous pressure gradient. World J Gastrointest Surg 2023; 15(4): 664-673
- URL: https://www.wjgnet.com/1948-9366/full/v15/i4/664.htm
- DOI: https://dx.doi.org/10.4240/wjgs.v15.i4.664


