Copyright
©The Author(s) 2022.
World J Gastrointest Surg. Mar 27, 2022; 14(3): 260-267
Published online Mar 27, 2022. doi: 10.4240/wjgs.v14.i3.260
Published online Mar 27, 2022. doi: 10.4240/wjgs.v14.i3.260
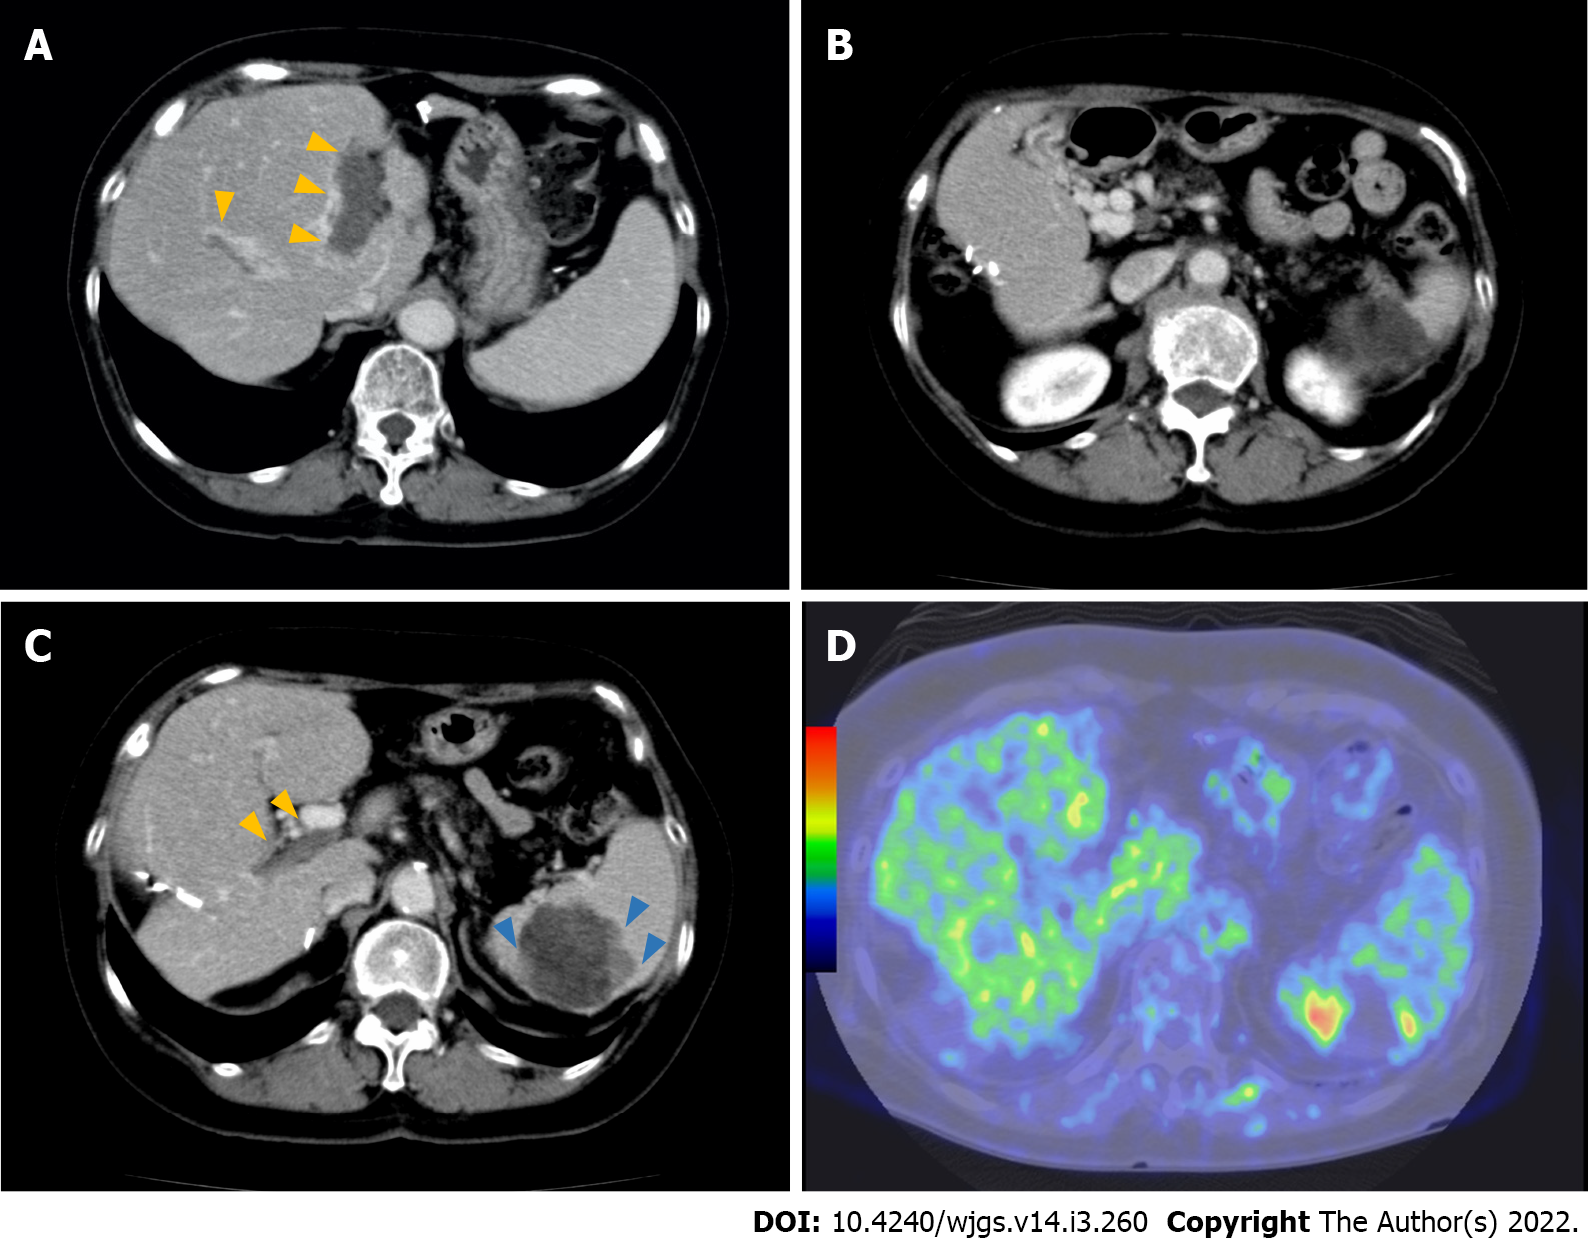
Figure 2 Radiological findings after the lenvatinib treatment.
A: Portal vein tumor thrombus (PVTT) becomes hypovascular (yellow arrows) 10 mo after the administration of lenvatinib. Dynamic computed tomography (CT), portal phase; B: The main portal vein is hypovascular, suggesting the organization of PVTT 10 mo after the administration of lenvatinib. Numerous collateral veins are seen around the portal vein. Dynamic CT, portal phase; C: PVTT remains hypovascular (yellow arrows), whereas hypervascular lesions increase the peripheral lesions of the spleen metastases (blue arrows) 8 mo after the cessation of lenvatinib. Dynamic CT, portal phase; D: Fluorodeoxyglucose (FDG) uptakes in the lower pole of the spleen (blue arrows) corresponding to hypervascular lesions on CT. FDG-positron emission tomography.
- Citation: Endo Y, Shimazu M, Sakuragawa T, Uchi Y, Edanami M, Sunamura K, Ozawa S, Chiba N, Kawachi S. Successful treatment with laparoscopic surgery and sequential multikinase inhibitor therapy for hepatocellular carcinoma: A case report. World J Gastrointest Surg 2022; 14(3): 260-267
- URL: https://www.wjgnet.com/1948-9366/full/v14/i3/260.htm
- DOI: https://dx.doi.org/10.4240/wjgs.v14.i3.260


