Copyright
©The Author(s) 2022.
World J Gastrointest Surg. Feb 27, 2022; 14(2): 143-160
Published online Feb 27, 2022. doi: 10.4240/wjgs.v14.i2.143
Published online Feb 27, 2022. doi: 10.4240/wjgs.v14.i2.143
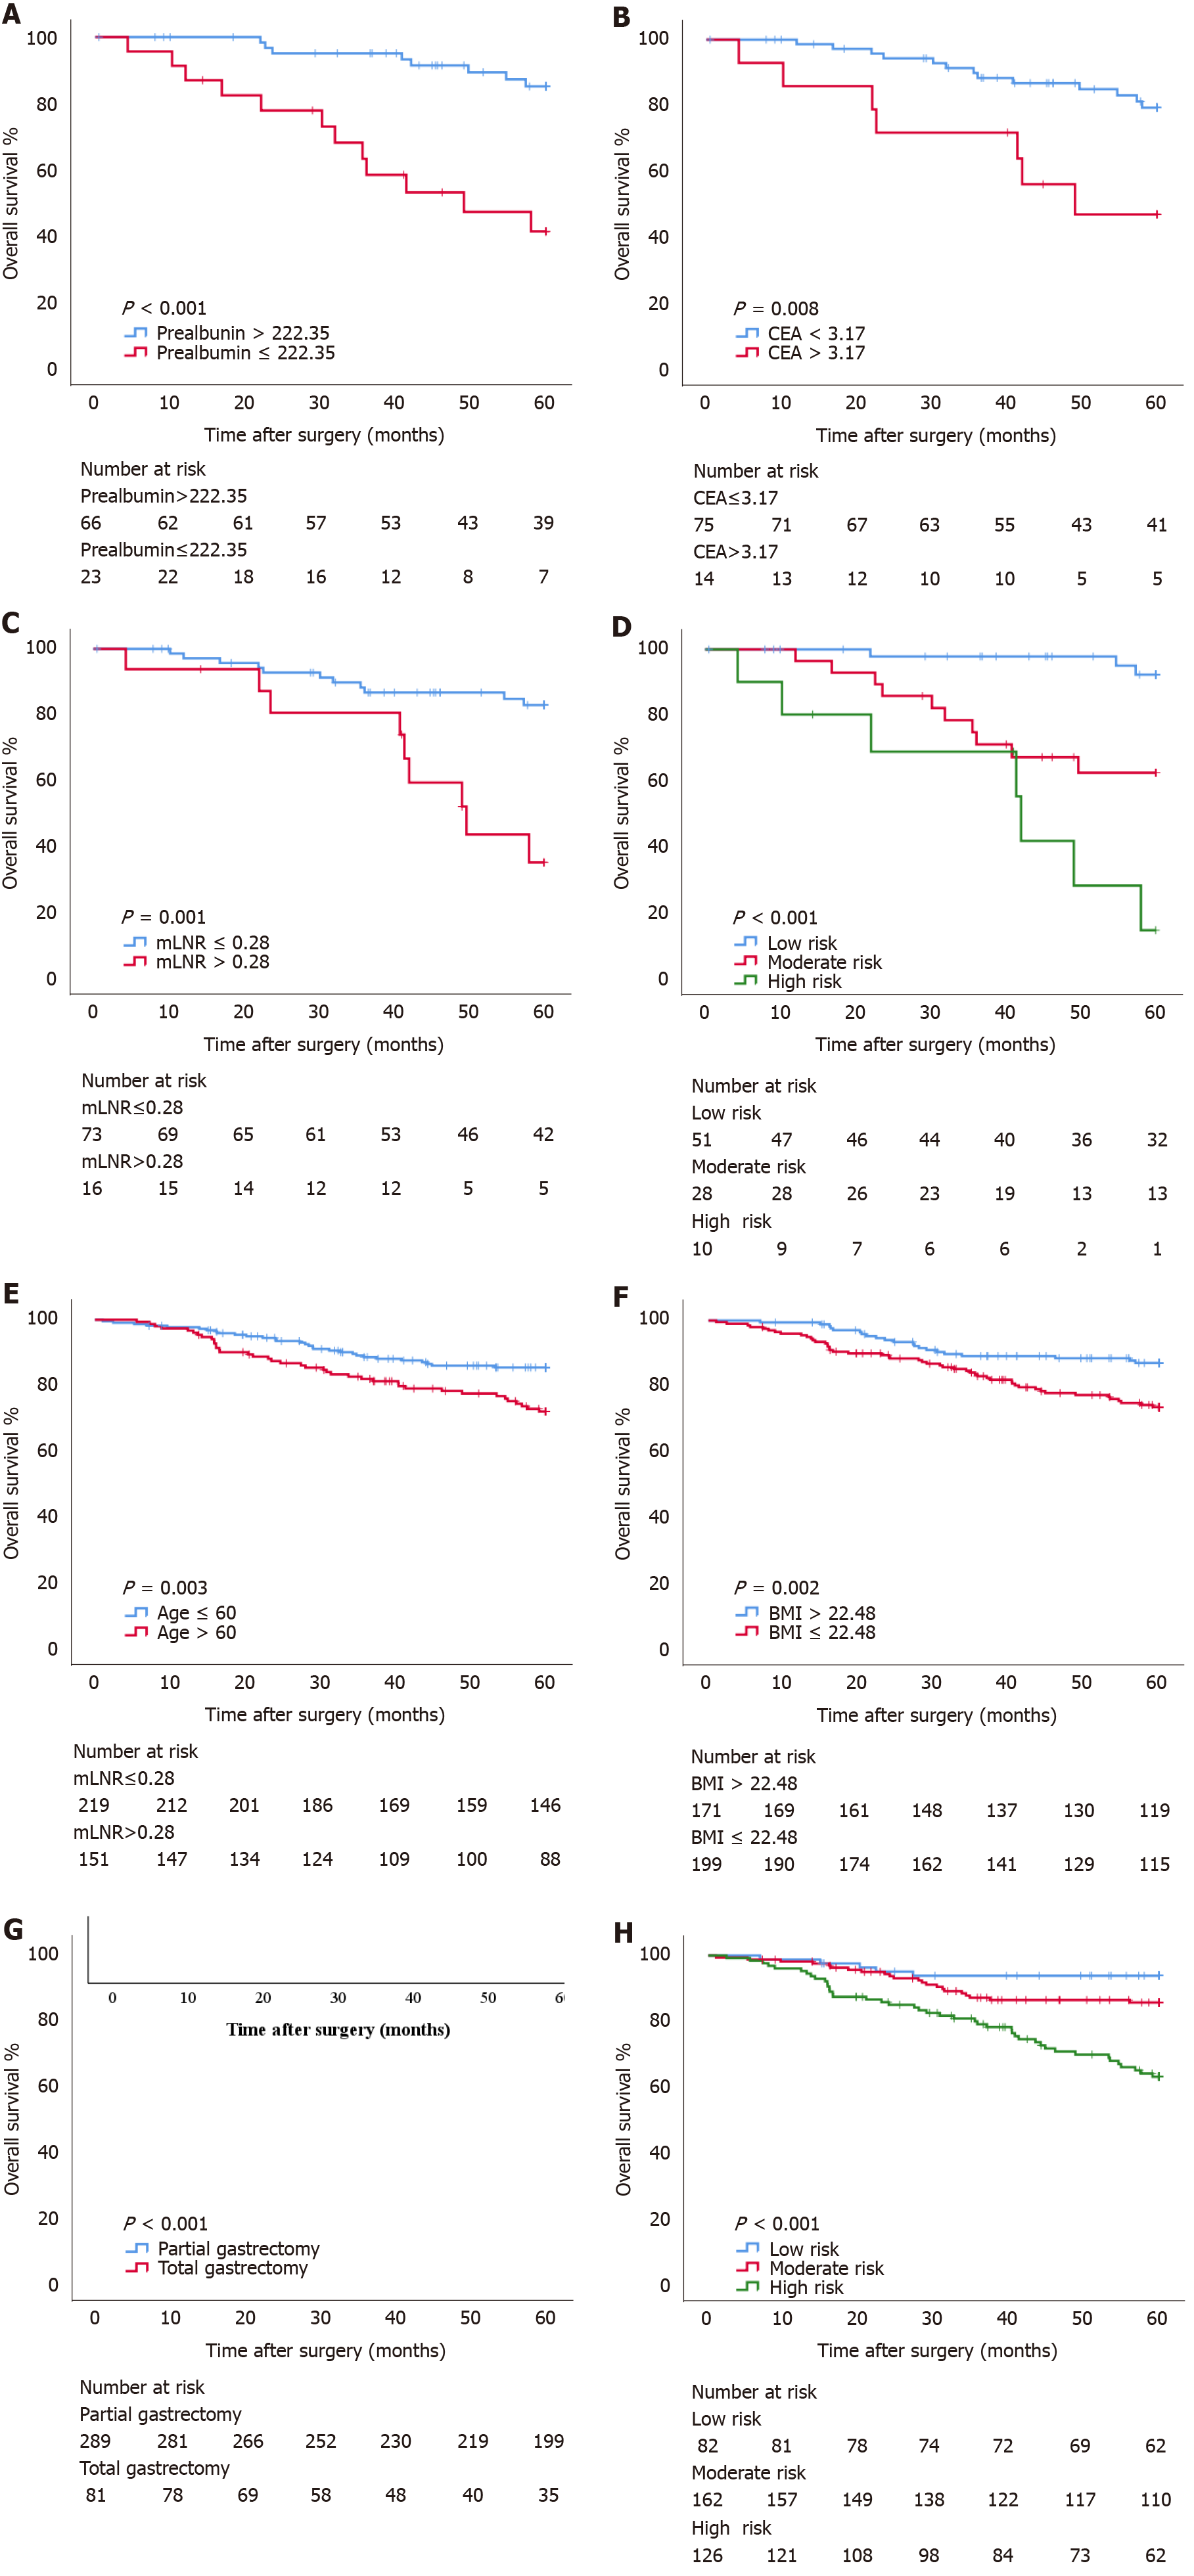
Figure 3 Survival curve subgroup analyses of patients.
A: Overall survival curves for patients with prealbumin ≤ 222.35 mg/L and prealbumin > 222.35 mg/L in the pT1N2-3 group; B: Overall survival curves for patients with carcino-embryonic antigen (CEA) ≤ 3.17 ng/mL and CEA > 3.17 ng/mL in the pT1N2-3 group; C: Overall survival curves for patients with metastatic lymph node ratio (mLNR) ≤ 0.28 and mLNR > 0.28 in the pT1N2-3 group; D: Overall survival curves for patients with low risk, moderate risk, and high risk in the pT1N2-3 group; E: Overall survival curves for patients aged ≤ 60 years and aged > 60 years in the pT3N0 group; F: Overall survival curves for patients with body mass index (BMI) ≤ 22.48 kg/m2 and BMI > 22.48 kg/m2 in the pT3N0 group; G: Overall survival curves for patients with partial gastrectomy and total gastrectomy in the pT3N0 group; H: Overall survival curves for patients with low risk, moderate risk, and high risk in the pT3N0 group. CEA: Carcino-embryonic antigen; mLNR: Metastatic lymph node ratio; BMI: Body mass index.
- Citation: Wang YF, Yin X, Fang TY, Wang YM, Zhang DX, Zhang Y, Wang XB, Wang H, Xue YW. Nomograms predicting prognosis of patients with pathological stages T1N2-3 and T3N0 gastric cancer. World J Gastrointest Surg 2022; 14(2): 143-160
- URL: https://www.wjgnet.com/1948-9366/full/v14/i2/143.htm
- DOI: https://dx.doi.org/10.4240/wjgs.v14.i2.143


