Copyright
©The Author(s) 2022.
World J Gastrointest Surg. Dec 27, 2022; 14(12): 1350-1362
Published online Dec 27, 2022. doi: 10.4240/wjgs.v14.i12.1350
Published online Dec 27, 2022. doi: 10.4240/wjgs.v14.i12.1350
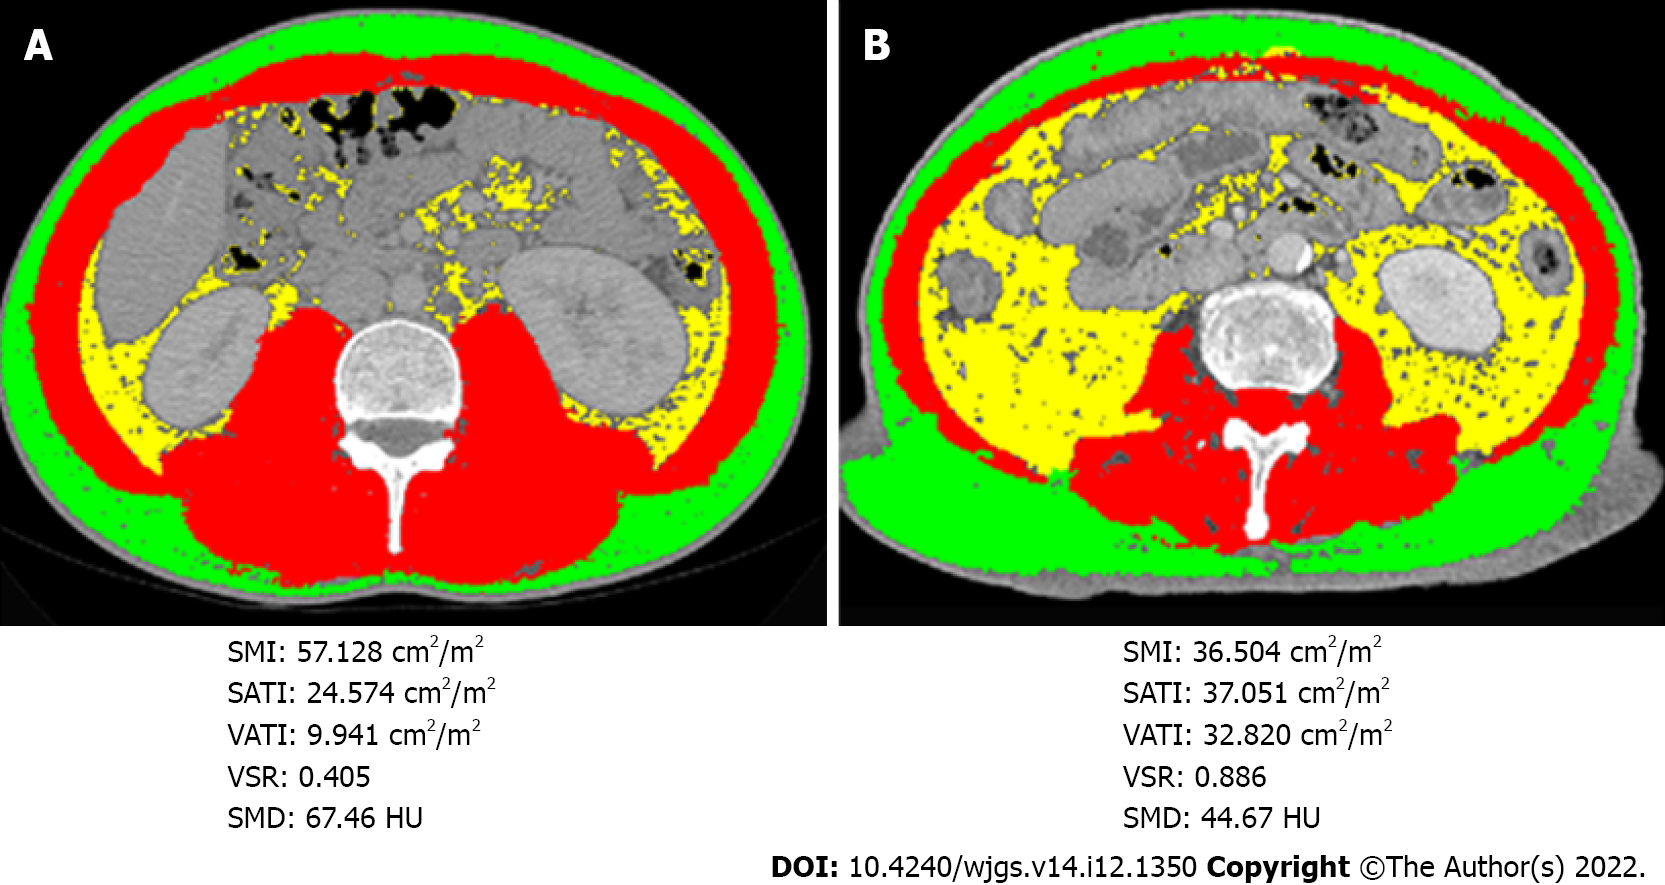
Figure 1 Selective representative computed tomography images with tag overlay at the third lumbar vertebra level from two individual patients with pancreatic cancer presenting with similar body mass index (21.
45 kg/m2 in patient A and 21.48 kg/m2 in patient B). The red, yellow and green shadows indicate the skeletal muscle area (SMA), visceral adipose tissue area (VATA), and subcutaneous adipose tissue area (SATA), respectively. Skeletal muscle index, subcutaneous adipose tissue index and visceral adipose tissue index were calculated from SATA, VATA, and SMA divided by height in meters squared, respectively. The visceral to subcutaneous adipose tissue area ratio was calculated by dividing VATA by SATA. Skeletal muscle density indicates the mean computed tomography value (HU) of SMA. A: Body mass index (BMI): 21.45; B: BMI: 21.48. SMI: Skeletal muscle index; SATI: Subcutaneous adipose tissue index; VATI: Visceral adipose tissue index; VSR: Visceral to subcutaneous adipose tissue area ratio; SMD: Skeletal muscle density; HU: Hounsfield unit.
- Citation: Cai ZW, Li JL, Liu M, Wang HW, Jiang CY. Low preoperative skeletal muscle index increases the risk of mortality among resectable pancreatic cancer patients: A retrospective study. World J Gastrointest Surg 2022; 14(12): 1350-1362
- URL: https://www.wjgnet.com/1948-9366/full/v14/i12/1350.htm
- DOI: https://dx.doi.org/10.4240/wjgs.v14.i12.1350


