Copyright
©The Author(s) 2022.
World J Gastrointest Surg. Oct 27, 2022; 14(10): 1150-1160
Published online Oct 27, 2022. doi: 10.4240/wjgs.v14.i10.1150
Published online Oct 27, 2022. doi: 10.4240/wjgs.v14.i10.1150
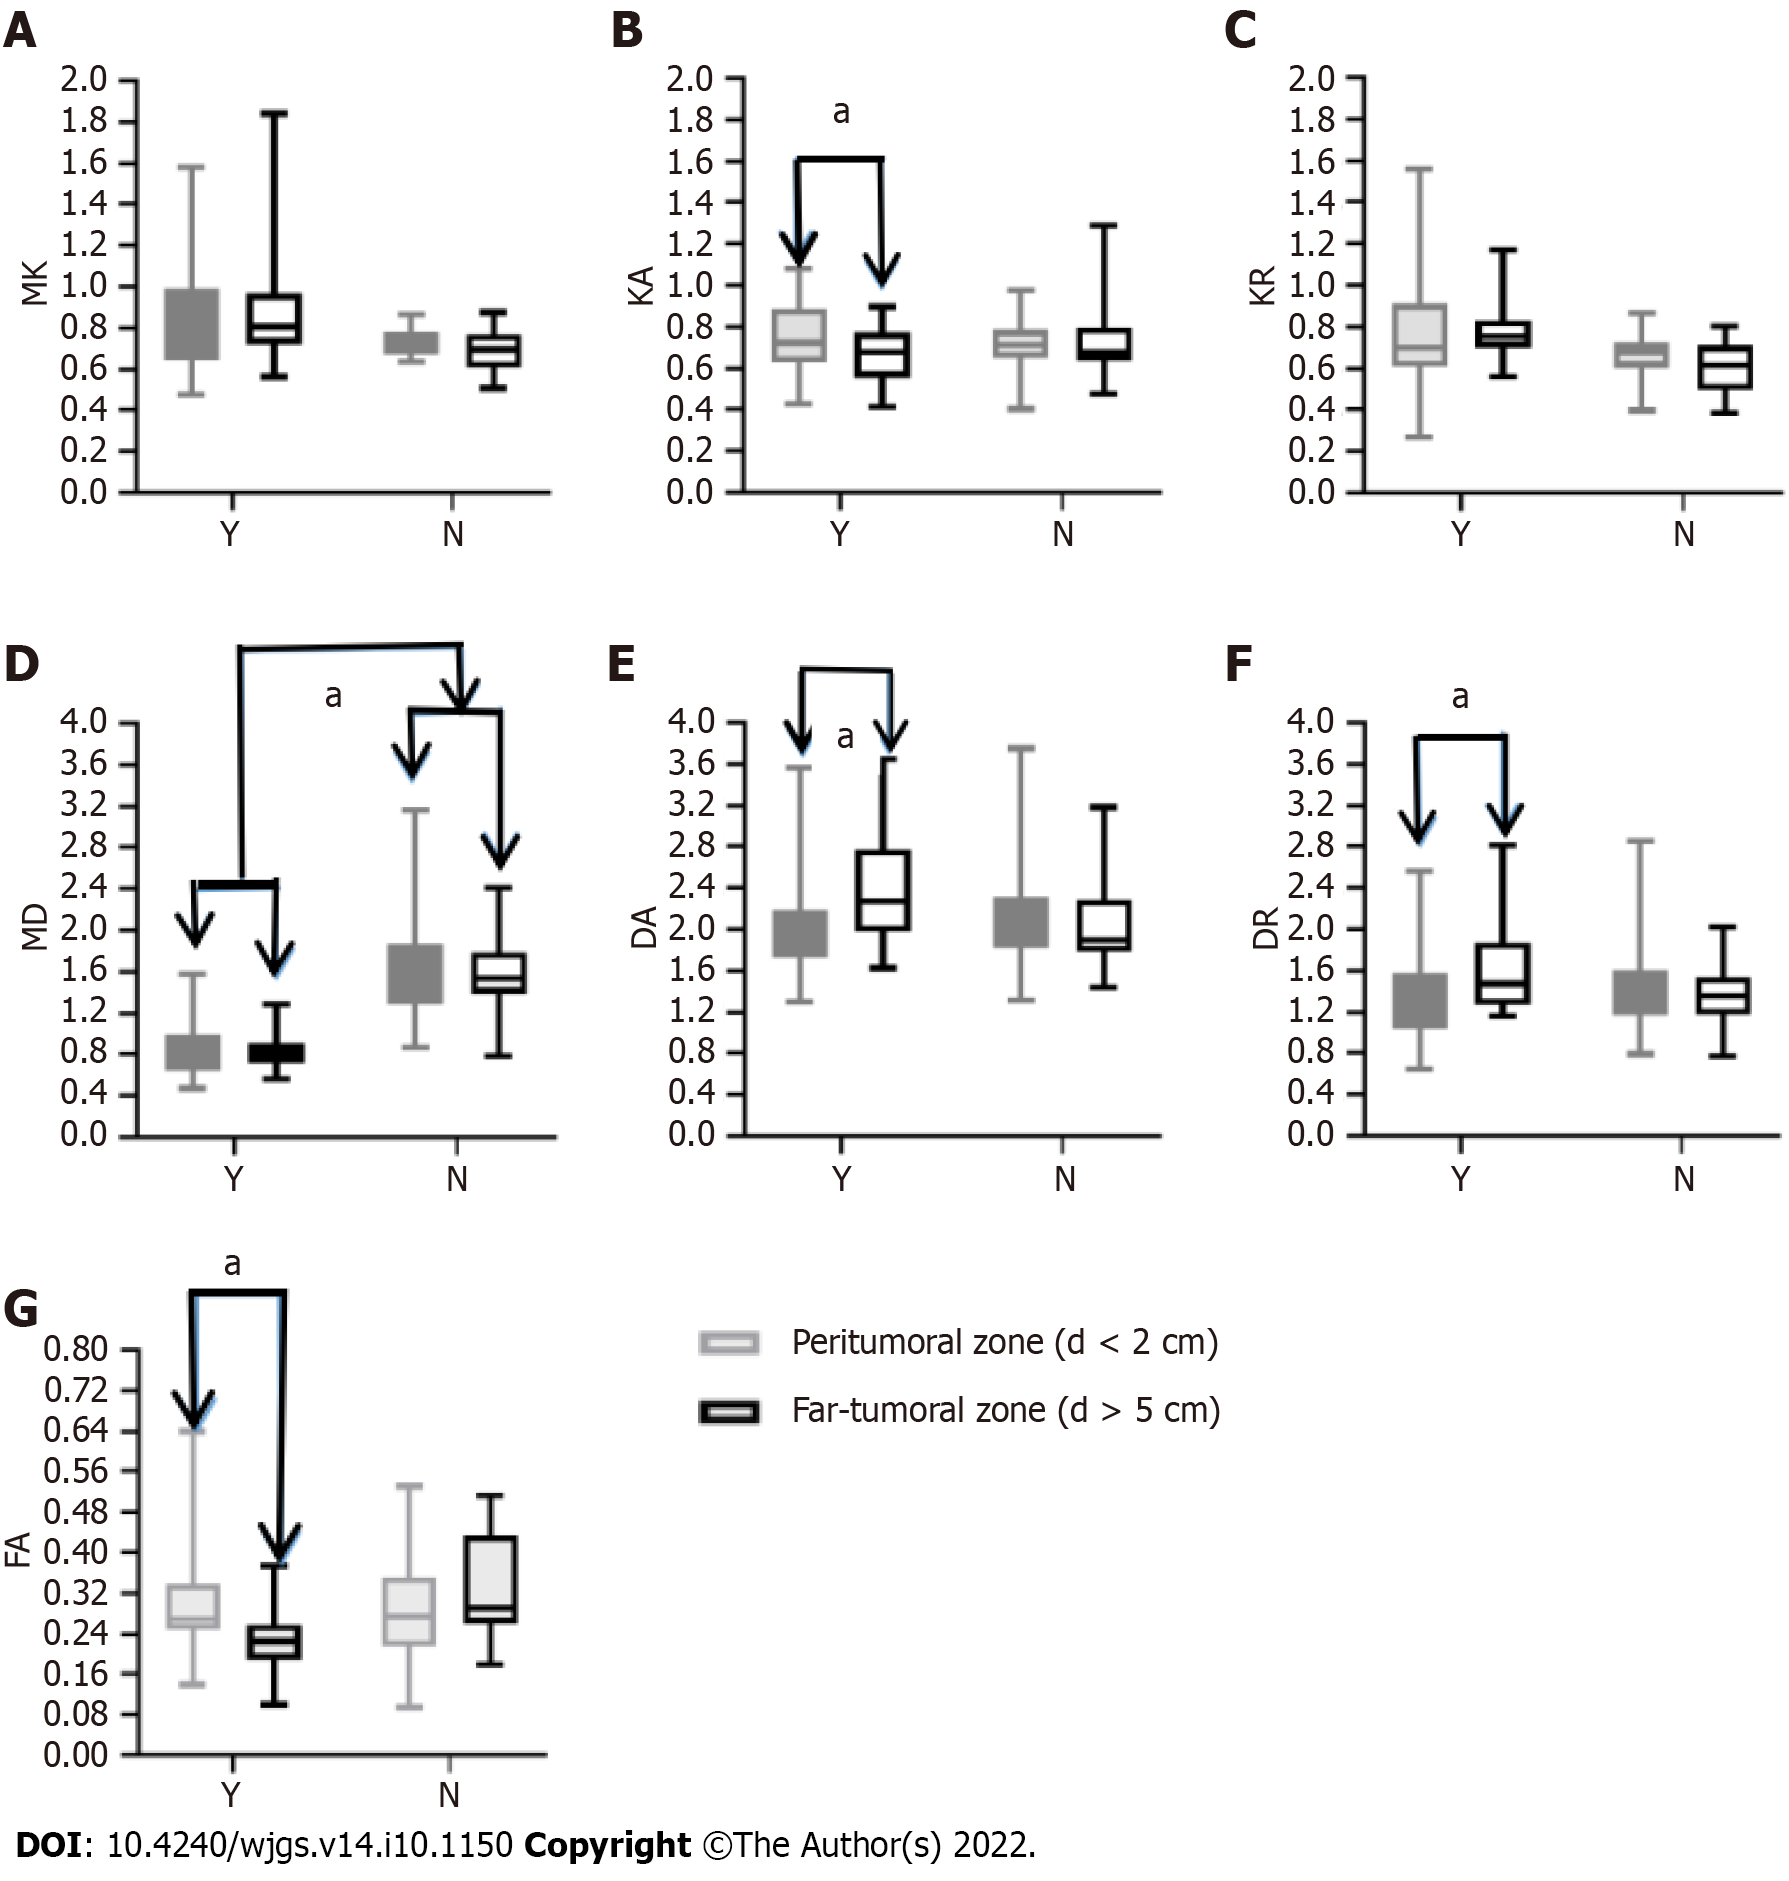
Figure 4 Box plots showing diffusion kurtosis imaging derived metrics of peritumoral zones between true and pseudo-progressing groups.
A: Mean kurtosis (MK); B: Axial kurtosis (KA); C: Radial kurtosis (KR); D: Mean diffusivity (MD); E: Axial diffusivity (DA); F: Radial diffusivity (DR); G: Anisotropy coefficient of kurtosis (FAk). aP < 0.05; the unit of MD, DA, and DR is 10-3 mm2/s. N = pseudo-progressing group; Y = true progressing group. FAk: Anisotropy coefficient of kurtosis; MD: Mean diffusivity; MK: Mean kurtosis; KA: Axial kurtosis; KR: Radial kurtosis; DA: Axial diffusivity; DR: Radial diffusivity.
- Citation: Cao X, Shi H, Dou WQ, Zhao XY, Zheng YX, Ge YP, Cheng HC, Geng DY, Wang JY. Can DKI-MRI predict recurrence and invasion of peritumoral zone of hepatocellular carcinoma after transcatheter arterial chemoembolization? World J Gastrointest Surg 2022; 14(10): 1150-1160
- URL: https://www.wjgnet.com/1948-9366/full/v14/i10/1150.htm
- DOI: https://dx.doi.org/10.4240/wjgs.v14.i10.1150


