Copyright
©The Author(s) 2022.
World J Gastrointest Surg. Oct 27, 2022; 14(10): 1150-1160
Published online Oct 27, 2022. doi: 10.4240/wjgs.v14.i10.1150
Published online Oct 27, 2022. doi: 10.4240/wjgs.v14.i10.1150
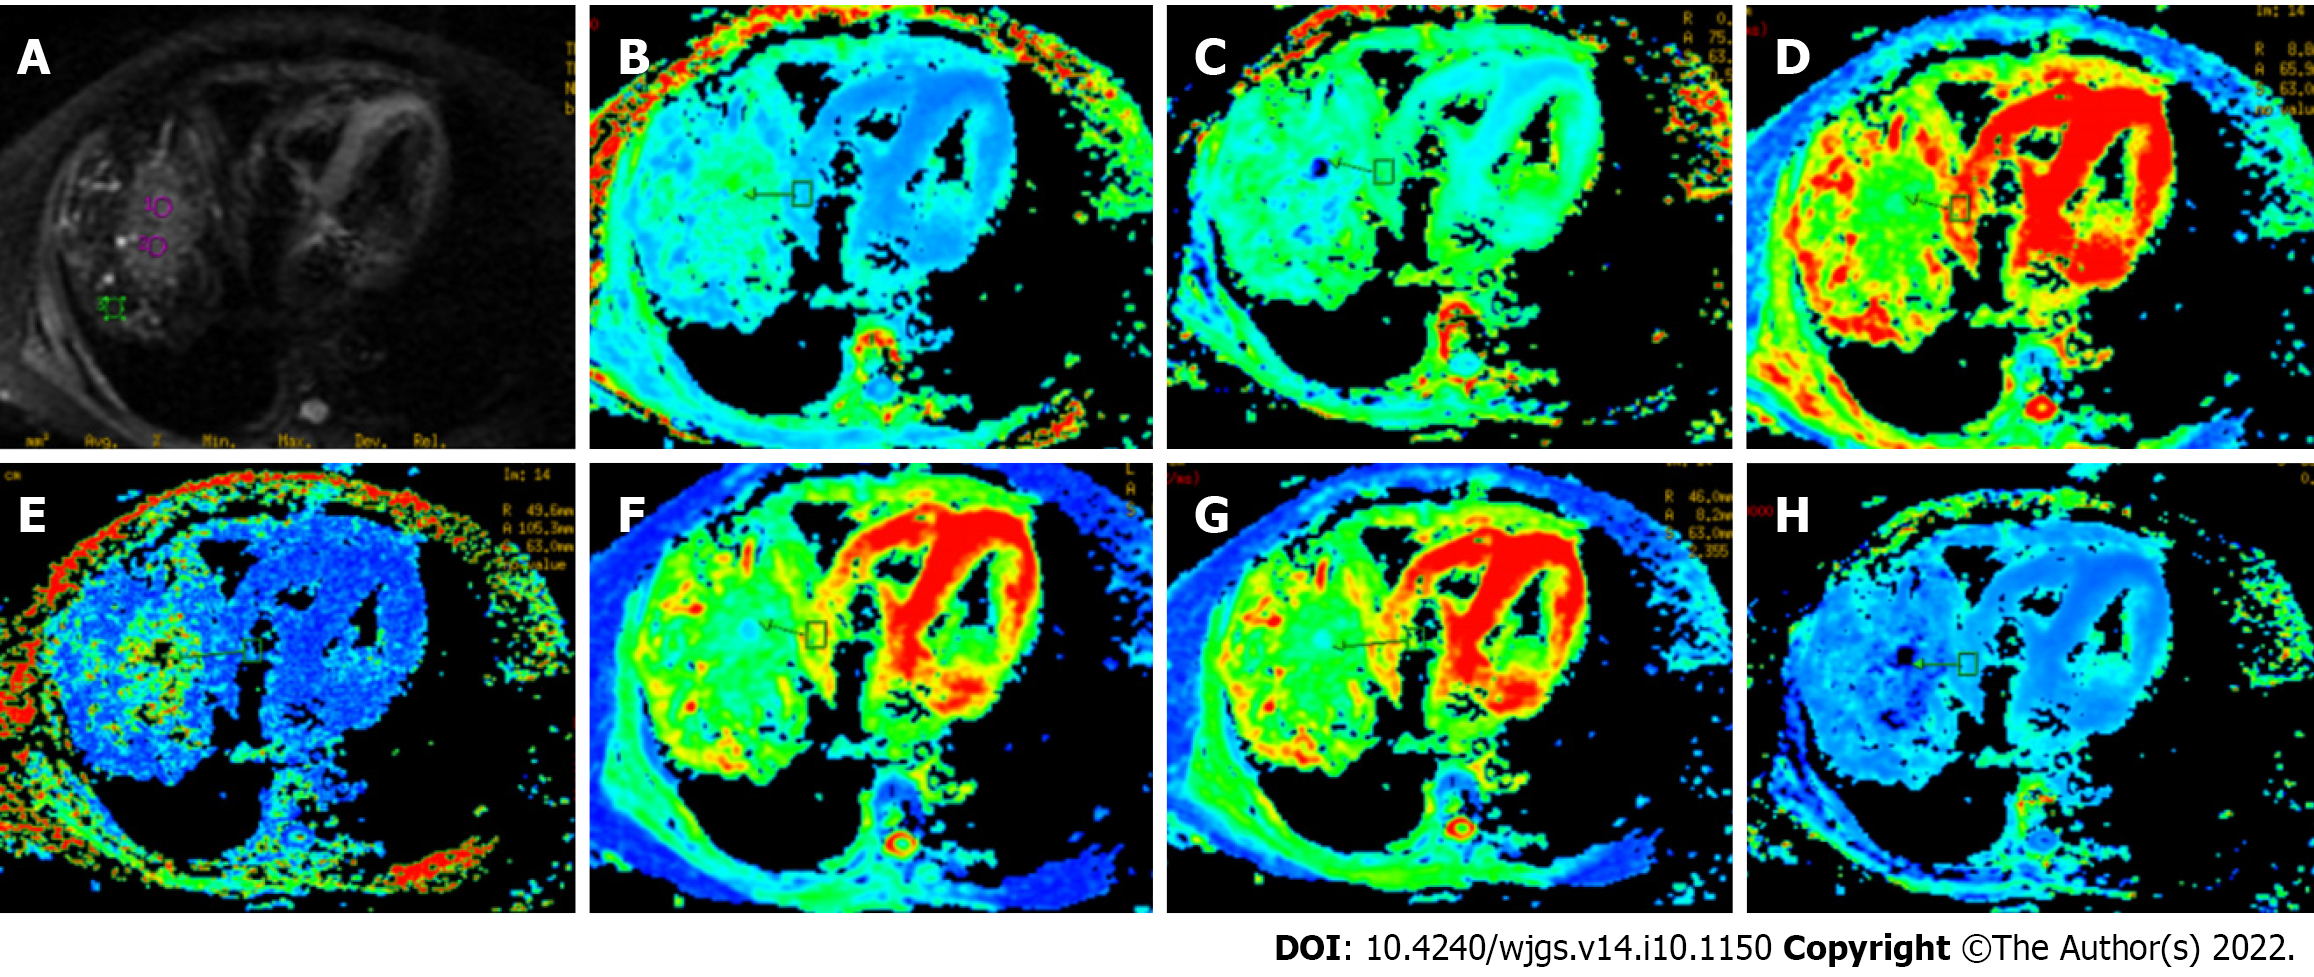
Figure 2 Representative maps of transcatheter arterial chemoembolization-treated and recurrent hepatocellular carcinoma foci.
The patient was a 46-year-old man with transcatheter arterial chemoembolization-treated and recurrent hepatocellular carcinoma foci. A: Diffusion map with b = 0 s/mm2; B: Maps of mean kurtosis (MK); C: Maps of mean diffusivity (MD); D: Maps of radial kurtosis (KR); E: Maps of axial kurtosis (KA); F: Maps of axial diffusivity (DA); G: Maps of radial diffusivity (DR); H: Maps of anisotropy coefficient of kurtosis (FAk). In the first map (A), the region of interest (ROI) (1) corresponds to the arrow pointing to a new lesion. The peritumoral zone (distance < 2 cm) refers to ROI (2) (red circle), and far-tumoral zone (diameter > 5 cm) refers to ROI (3) (green square).
- Citation: Cao X, Shi H, Dou WQ, Zhao XY, Zheng YX, Ge YP, Cheng HC, Geng DY, Wang JY. Can DKI-MRI predict recurrence and invasion of peritumoral zone of hepatocellular carcinoma after transcatheter arterial chemoembolization? World J Gastrointest Surg 2022; 14(10): 1150-1160
- URL: https://www.wjgnet.com/1948-9366/full/v14/i10/1150.htm
- DOI: https://dx.doi.org/10.4240/wjgs.v14.i10.1150


