Copyright
©The Author(s) 2021.
World J Gastrointest Surg. Sep 27, 2021; 13(9): 1079-1094
Published online Sep 27, 2021. doi: 10.4240/wjgs.v13.i9.1079
Published online Sep 27, 2021. doi: 10.4240/wjgs.v13.i9.1079
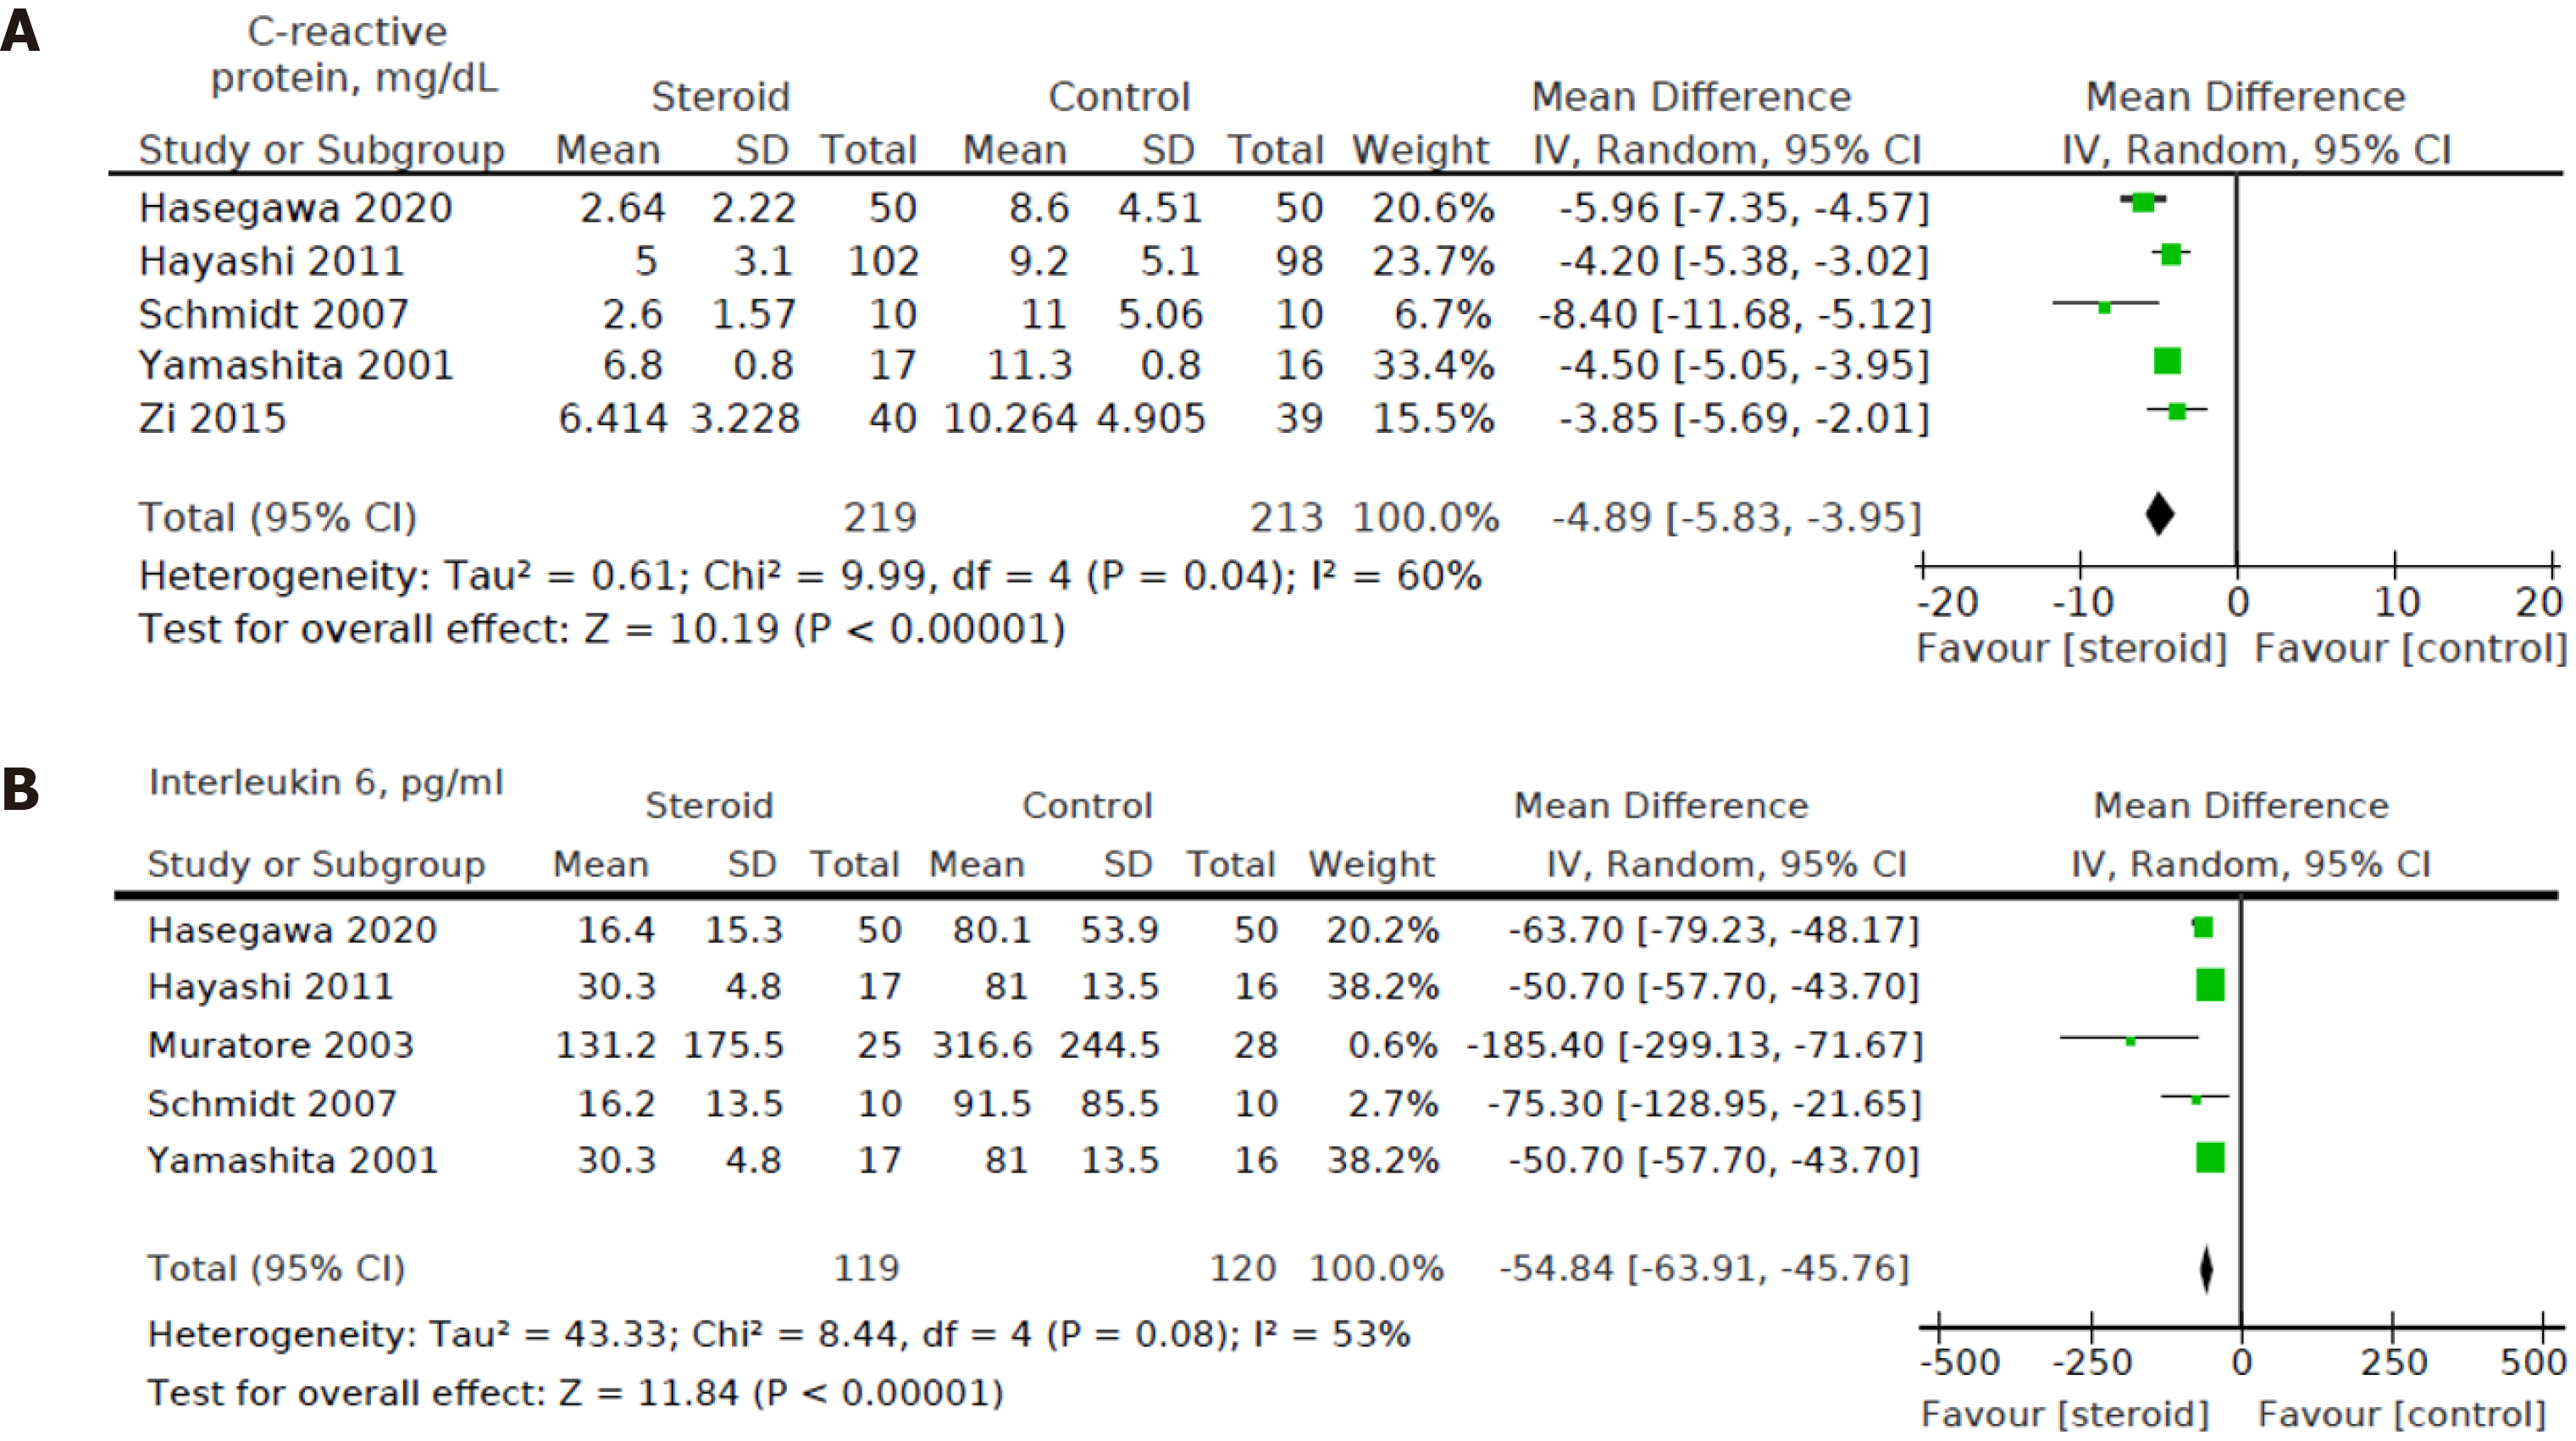
Figure 8 Pooled results comparing steroids group to the control group.
A: Postoperative day 3 C-reactive protein, mg/dL; B: Postoperative day 1 interleukin 6 levels, pg/mL illustrated by forest plots. Random effects model was used. IV: Inverse variance; CI: Confidence interval.
- Citation: Hai HH, Aw P, Teng TZJ, Shelat VG. Perioperative steroid administration reduces overall complications in patients undergoing liver resection: A meta-analysis. World J Gastrointest Surg 2021; 13(9): 1079-1094
- URL: https://www.wjgnet.com/1948-9366/full/v13/i9/1079.htm
- DOI: https://dx.doi.org/10.4240/wjgs.v13.i9.1079


