Copyright
©The Author(s) 2020.
World J Gastrointest Surg. Nov 27, 2020; 12(11): 442-459
Published online Nov 27, 2020. doi: 10.4240/wjgs.v12.i11.442
Published online Nov 27, 2020. doi: 10.4240/wjgs.v12.i11.442
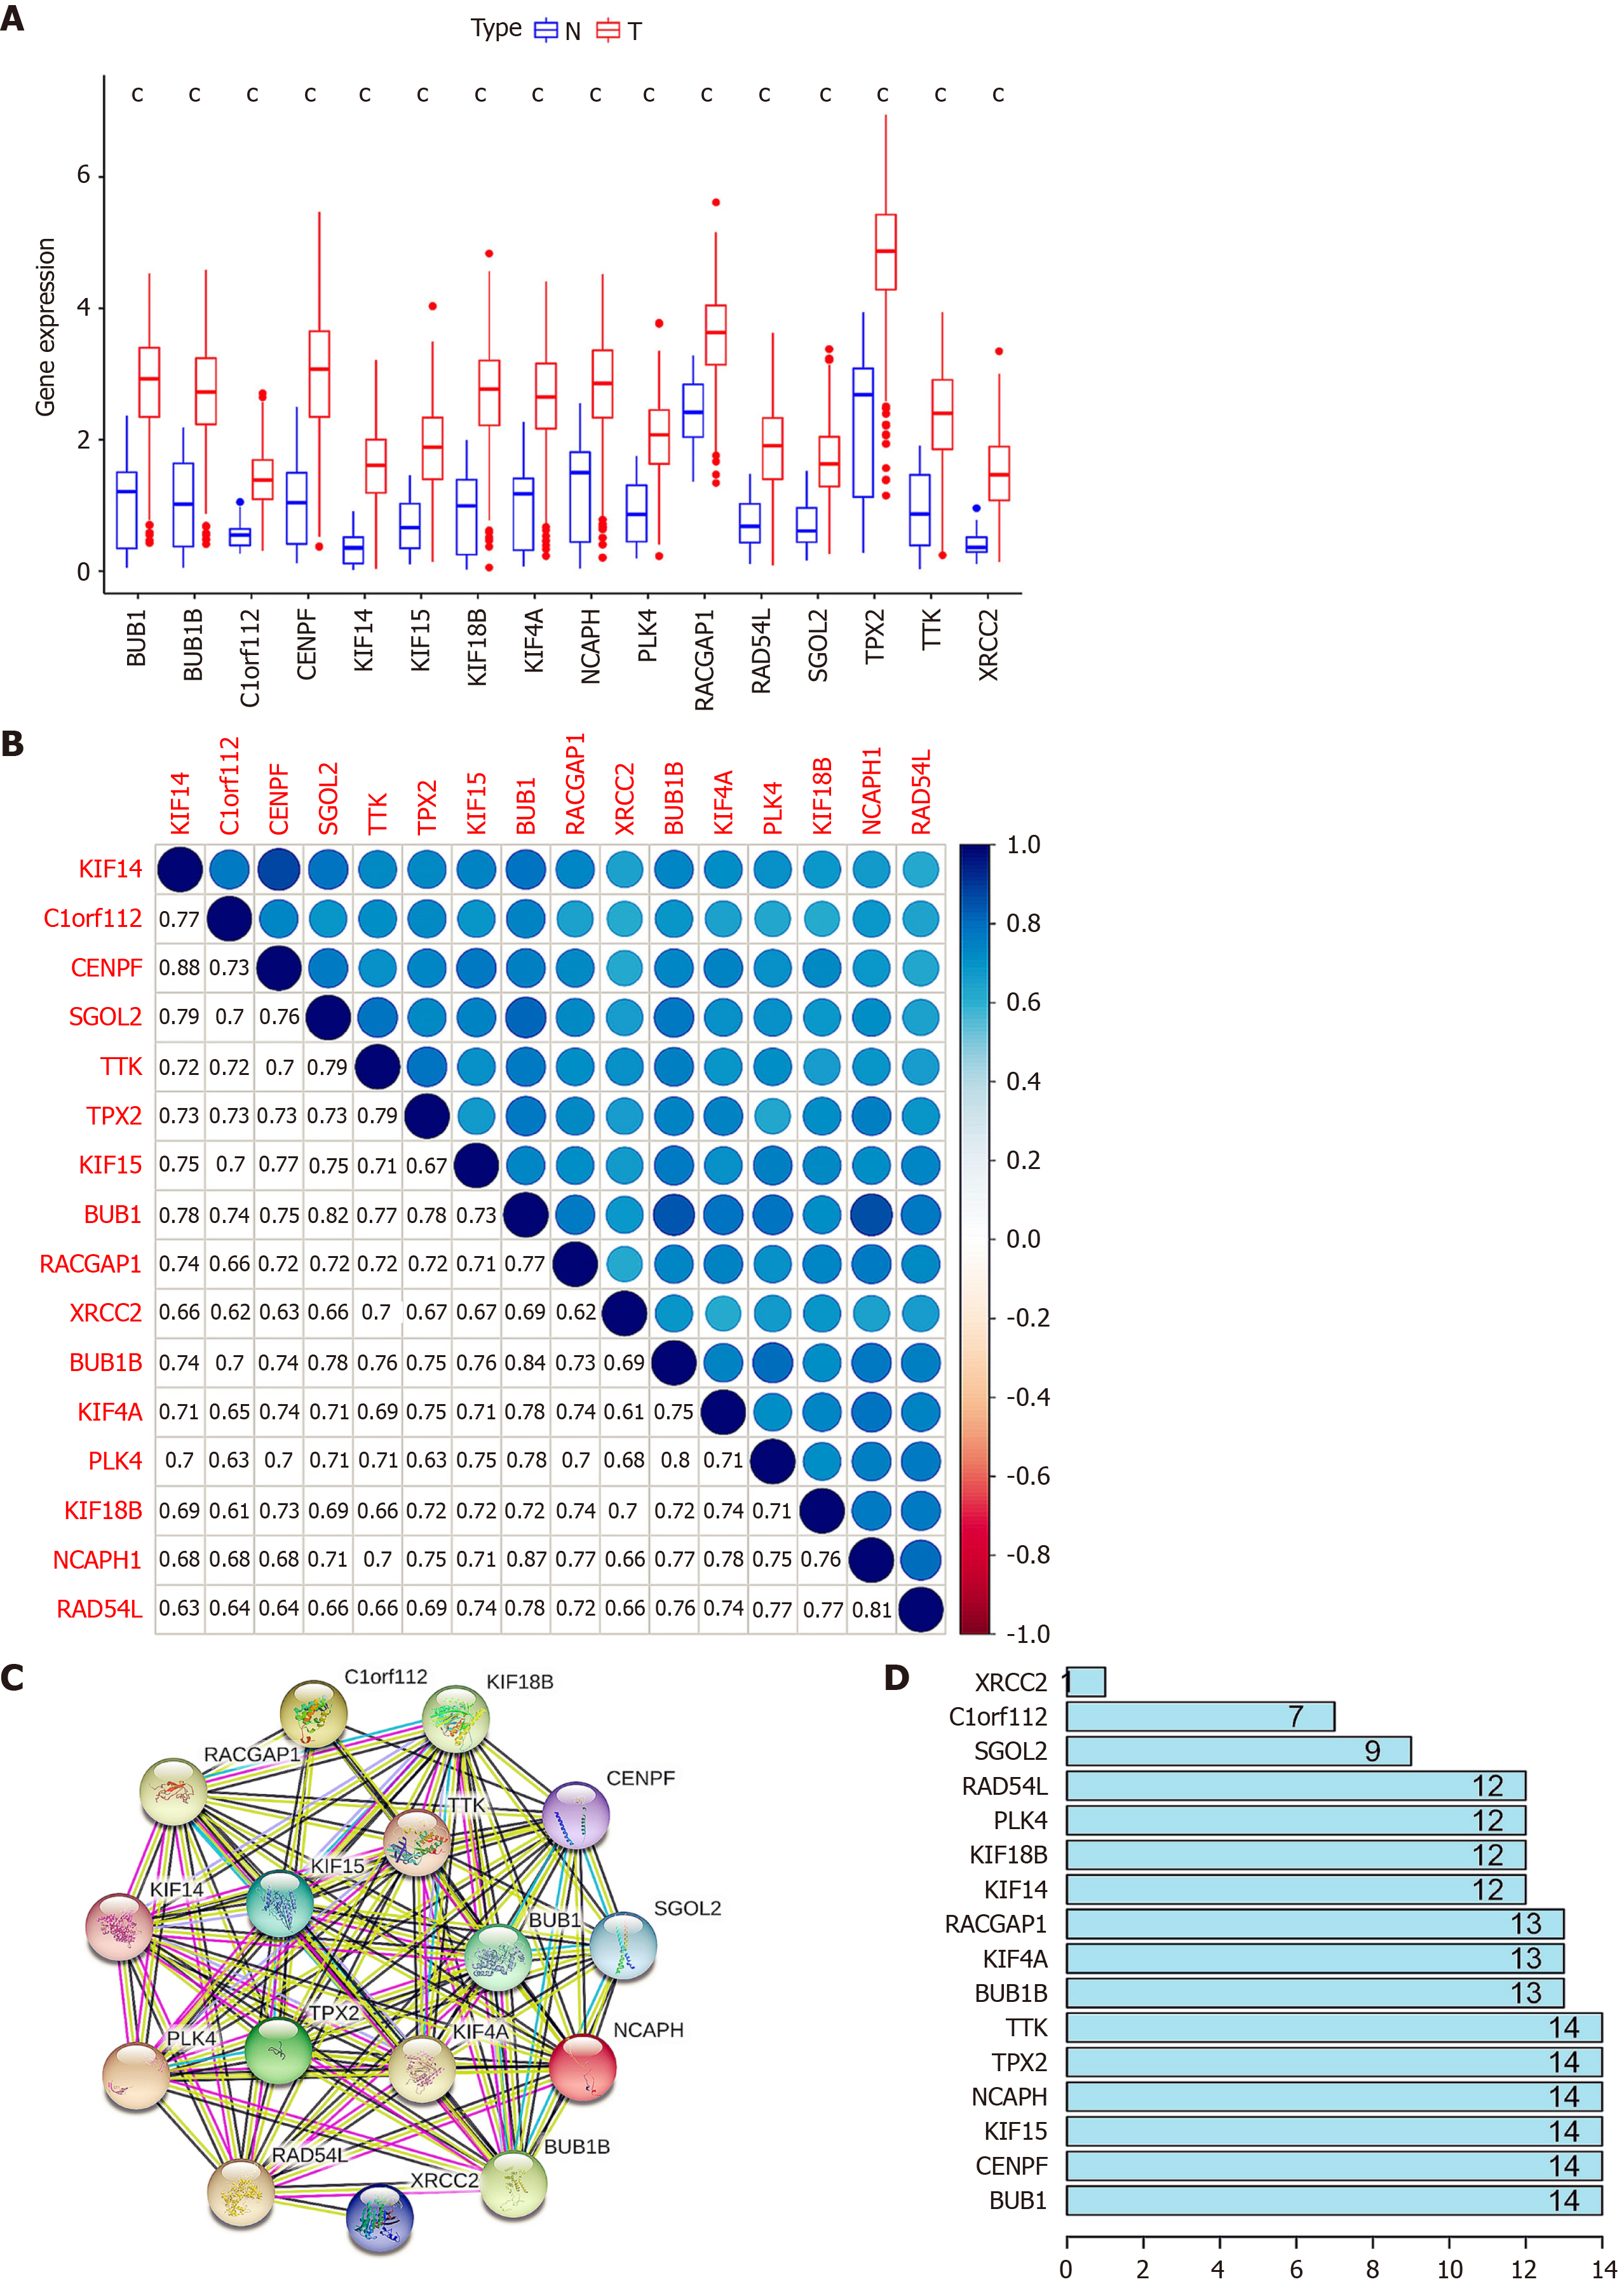
Figure 3 Analysis of key genes.
A: Expression of the key genes in gastric tumor tissues and normal gastric tissues. The red histogram indicates gastric tumor tissue. The blue histogram indicates normal gastric tissue. cP < 0.001; B: Correlation of key genes. The number in the box represents the size of the correlation, and the larger the number, the higher the correlation; C: Protein-protein interaction networks of key genes. The color of the lines represents the source of the evidence; D: Connection nodes of key genes. The number represents the number of connection nodes.
- Citation: Huang C, Hu CG, Ning ZK, Huang J, Zhu ZM. Identification of key genes controlling cancer stem cell characteristics in gastric cancer. World J Gastrointest Surg 2020; 12(11): 442-459
- URL: https://www.wjgnet.com/1948-9366/full/v12/i11/442.htm
- DOI: https://dx.doi.org/10.4240/wjgs.v12.i11.442


