Copyright
©The Author(s) 2019.
World J Gastrointest Surg. Mar 27, 2019; 11(3): 169-178
Published online Mar 27, 2019. doi: 10.4240/wjgs.v11.i3.169
Published online Mar 27, 2019. doi: 10.4240/wjgs.v11.i3.169
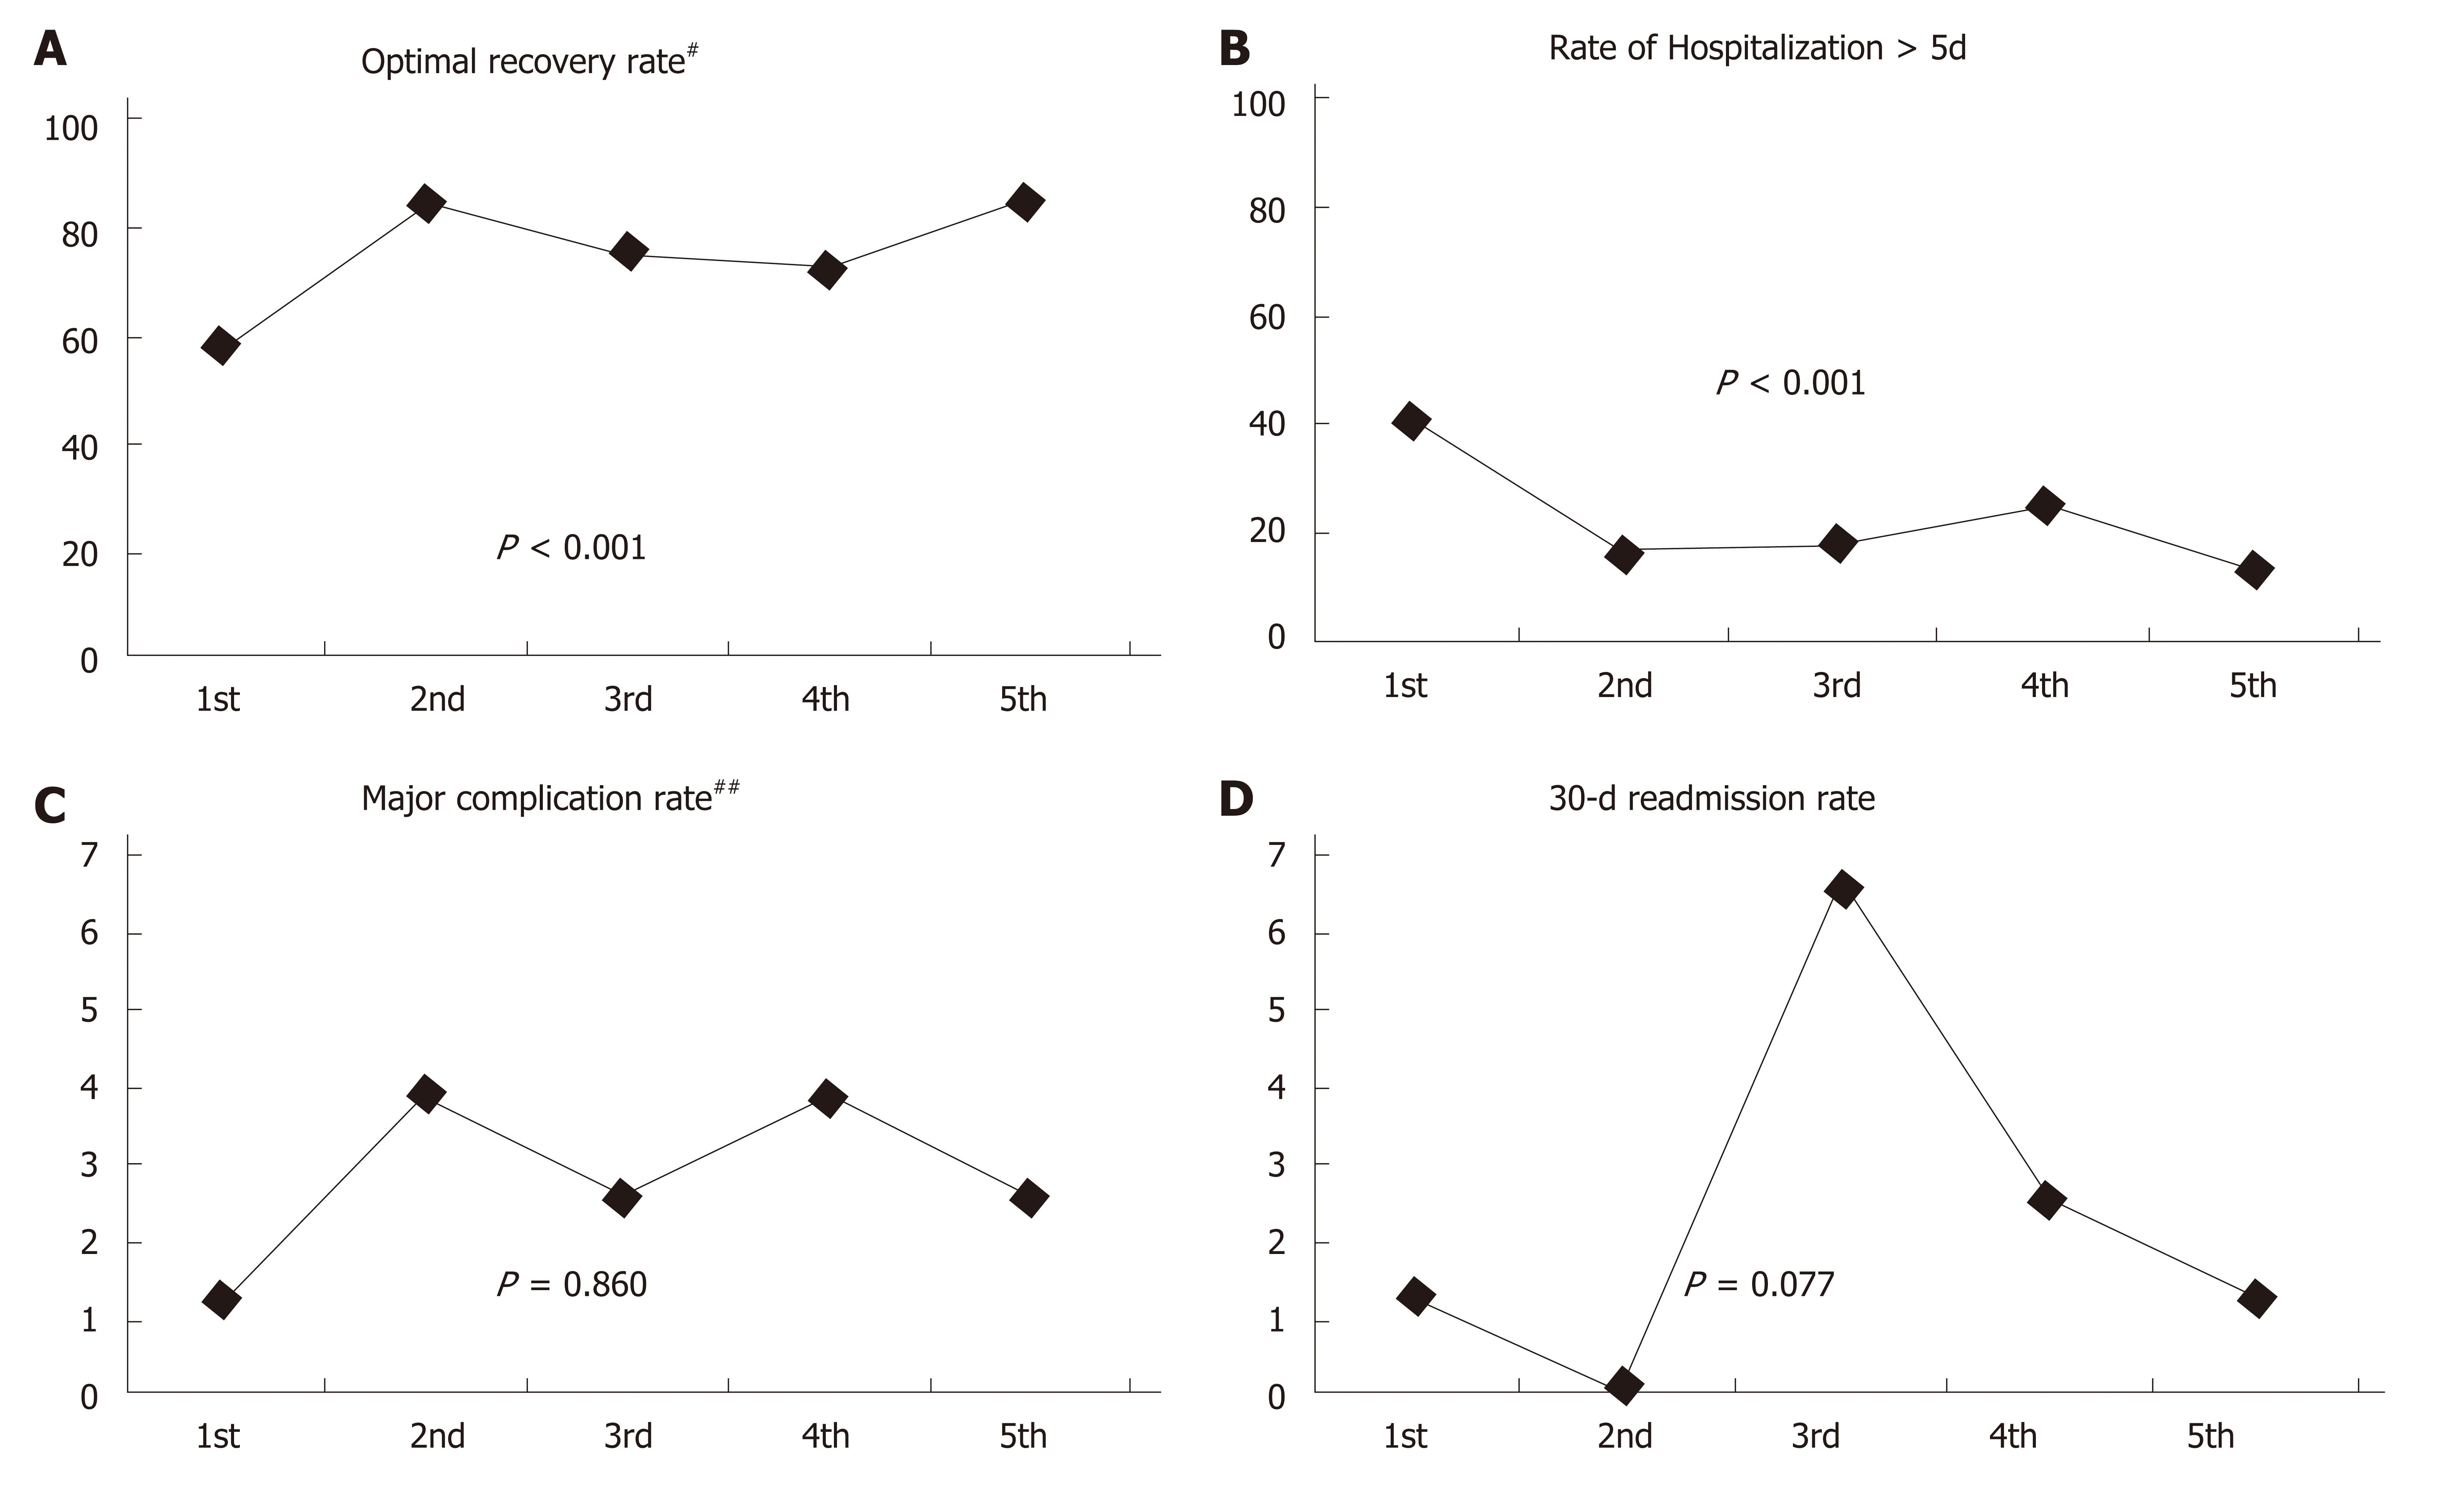
Figure 1 Enhanced recovery after surgery outcomes among each quintile (by chronological order).
A: Optimal recovery rate; B: Rate of hospitalization longer than 5 d; C: Major complication rate; D: 30-d readmission rate. X-axis shows 5 quintile groups and y-axis indicates a percentage. #Optimal recovery was defined as no major postoperative complication, discharge by postoperative day 5, and no 30-d readmission; ##Clavien-Dindo grade ≥ III.
- Citation: Lohsiriwat V. Learning curve of enhanced recovery after surgery program in open colorectal surgery. World J Gastrointest Surg 2019; 11(3): 169-178
- URL: https://www.wjgnet.com/1948-9366/full/v11/i3/169.htm
- DOI: https://dx.doi.org/10.4240/wjgs.v11.i3.169


