Copyright
©The Author(s) 2024.
World J Gastrointest Surg. Feb 27, 2024; 16(2): 438-450
Published online Feb 27, 2024. doi: 10.4240/wjgs.v16.i2.438
Published online Feb 27, 2024. doi: 10.4240/wjgs.v16.i2.438
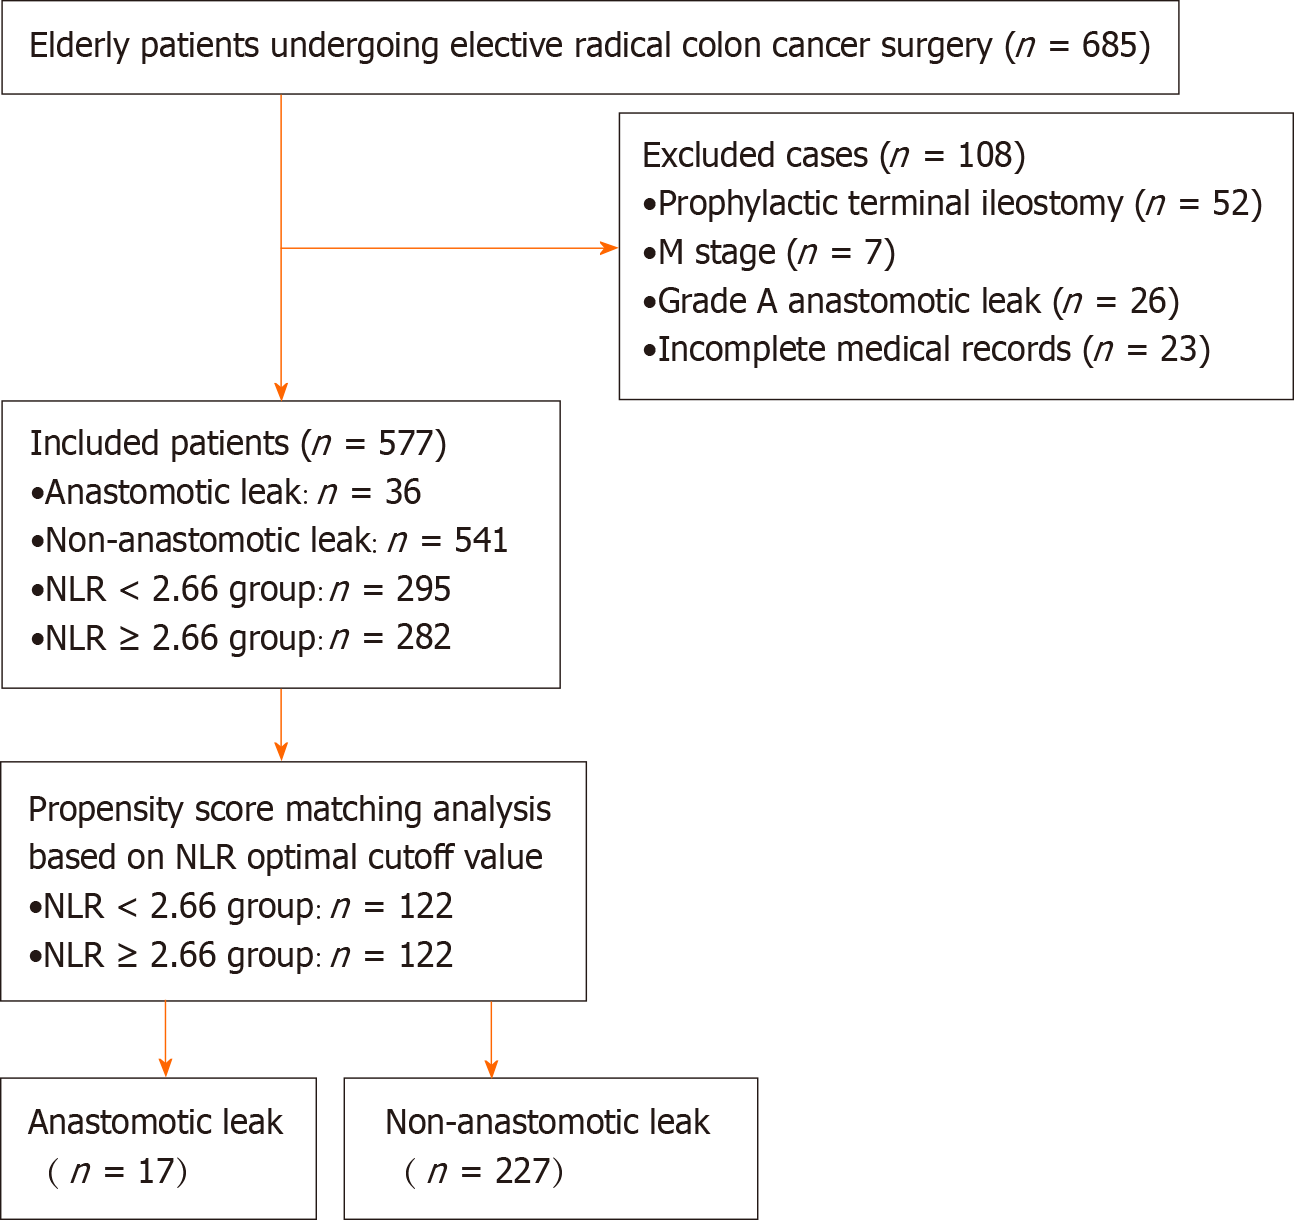
Figure 1 Study population enrollment process.
NLR: Neutrophil-to-lymphocyte ratio.
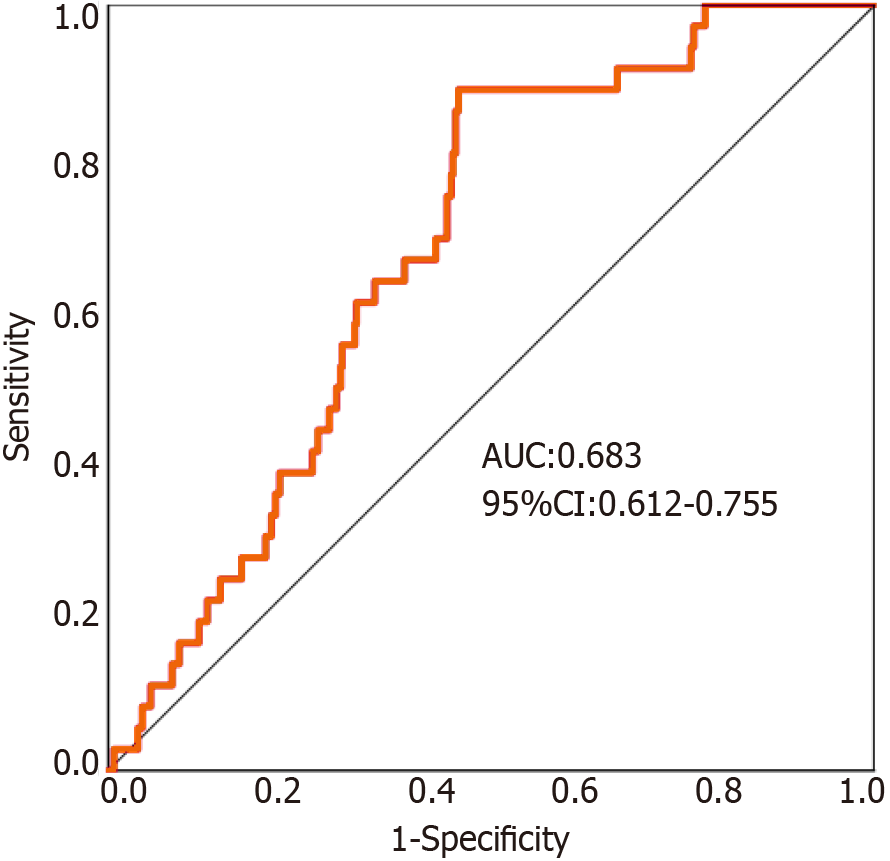
Figure 2 Receiver operating characteristic curve analysis of the ability of preoperative neutrophil-to-lymphocyte to predict symptomatic anastomotic leakage.
AUC: Area under the curve; CI: Confidence interval.
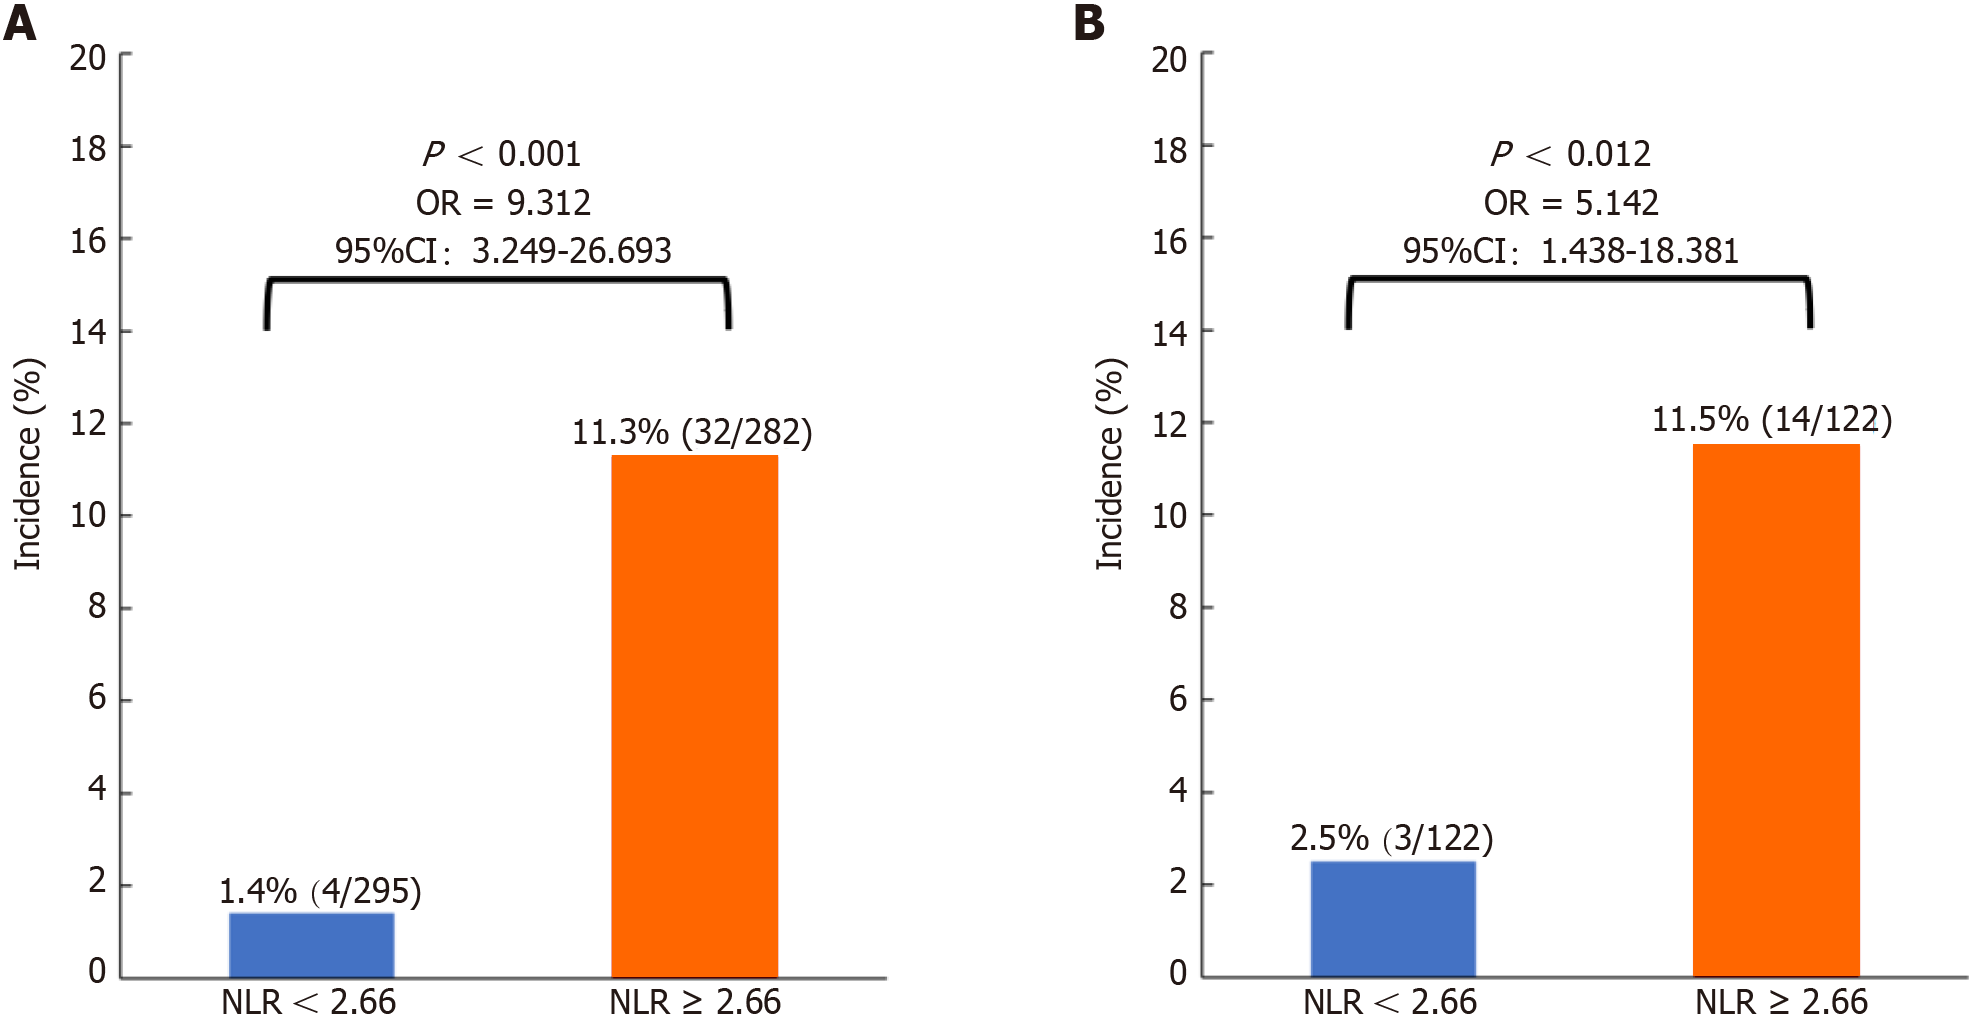
Figure 3 Comparison of the incidence of symptomatic anastomotic leakage between the neutrophil-to-lymphocyte ratio < 2.
66 and neutrophil-to-lymphocyte ratio ≥ 2.66 groups before and after propensity score matching. A: Before propensity score matching; B: After propensity score matching. NLR: Neutrophil-to-lymphocyte ratio; OR: Odds ratio; CI: Confidence interval.
- Citation: Wang CY, Li XL, Ma XL, Yang XF, Liu YY, Yu YJ. Preoperative neutrophil-to-lymphocyte ratio predicts symptomatic anastomotic leakage in elderly colon cancer patients: Multicenter propensity score-matched analysis. World J Gastrointest Surg 2024; 16(2): 438-450
- URL: https://www.wjgnet.com/1948-9366/full/v16/i2/438.htm
- DOI: https://dx.doi.org/10.4240/wjgs.v16.i2.438


