Copyright
©The Author(s) 2023.
World J Gastrointest Surg. Aug 27, 2023; 15(8): 1600-1614
Published online Aug 27, 2023. doi: 10.4240/wjgs.v15.i8.1600
Published online Aug 27, 2023. doi: 10.4240/wjgs.v15.i8.1600
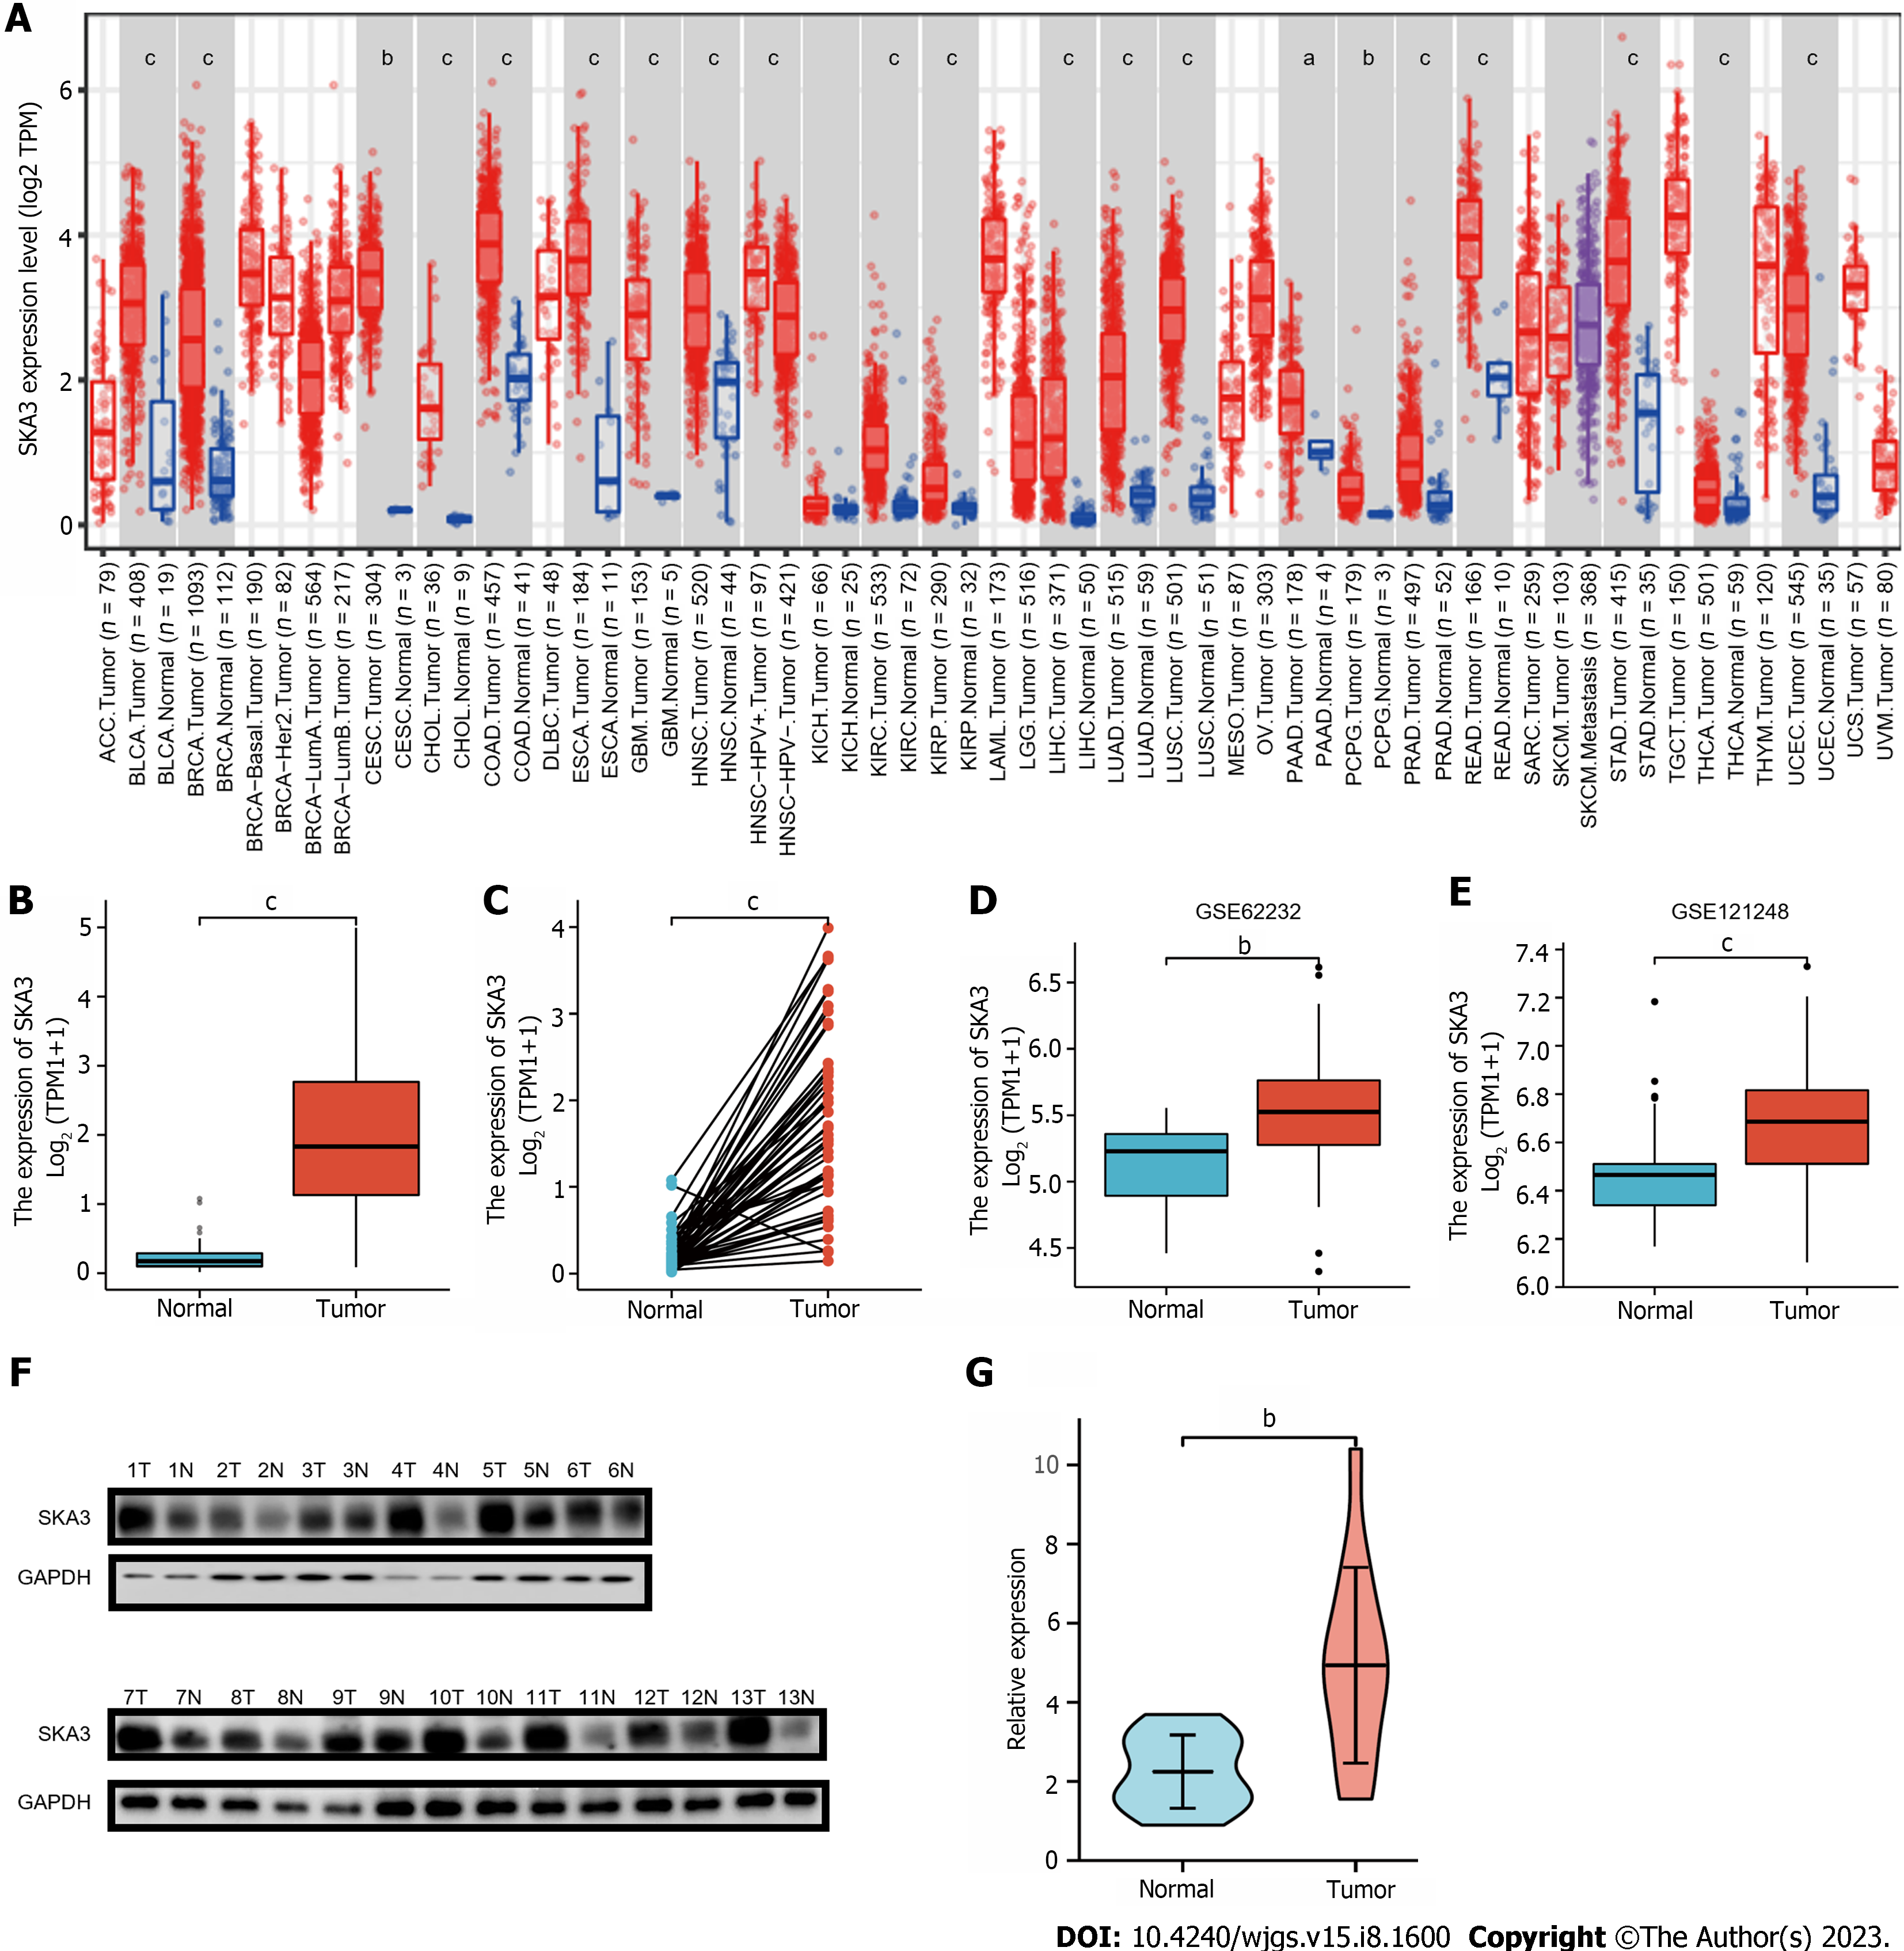
Figure 1 Spindle and kinetochore-associated complex subunit 3 expression levels in cancers.
A: Expression levels of spindle and kinetochore-associated complex subunit 3 (SKA3) in different cancers according to the Tumor Immune Estimation Resource database; B and C: Expression levels of SKA3 in hepatocellular carcinoma (HCC) tissues and normal tissues in The Cancer Genome Atlas database; B: Unmatched tissues; C: Matched tissues; D-G: Validation of high SKA3 expression in HCC using an external database and clinical specimens; D and E: GSE62232 and GSE121248 datasets; F: Western blot; G: The relative expression of SKA3 protein was analyzed by ImageJ software. SKA3: Spindle and kinetochore-associated complex subunit 3; HCC: Hepatocellular carcinoma. aP < 0.05, bP < 0.01, cP < 0.001.
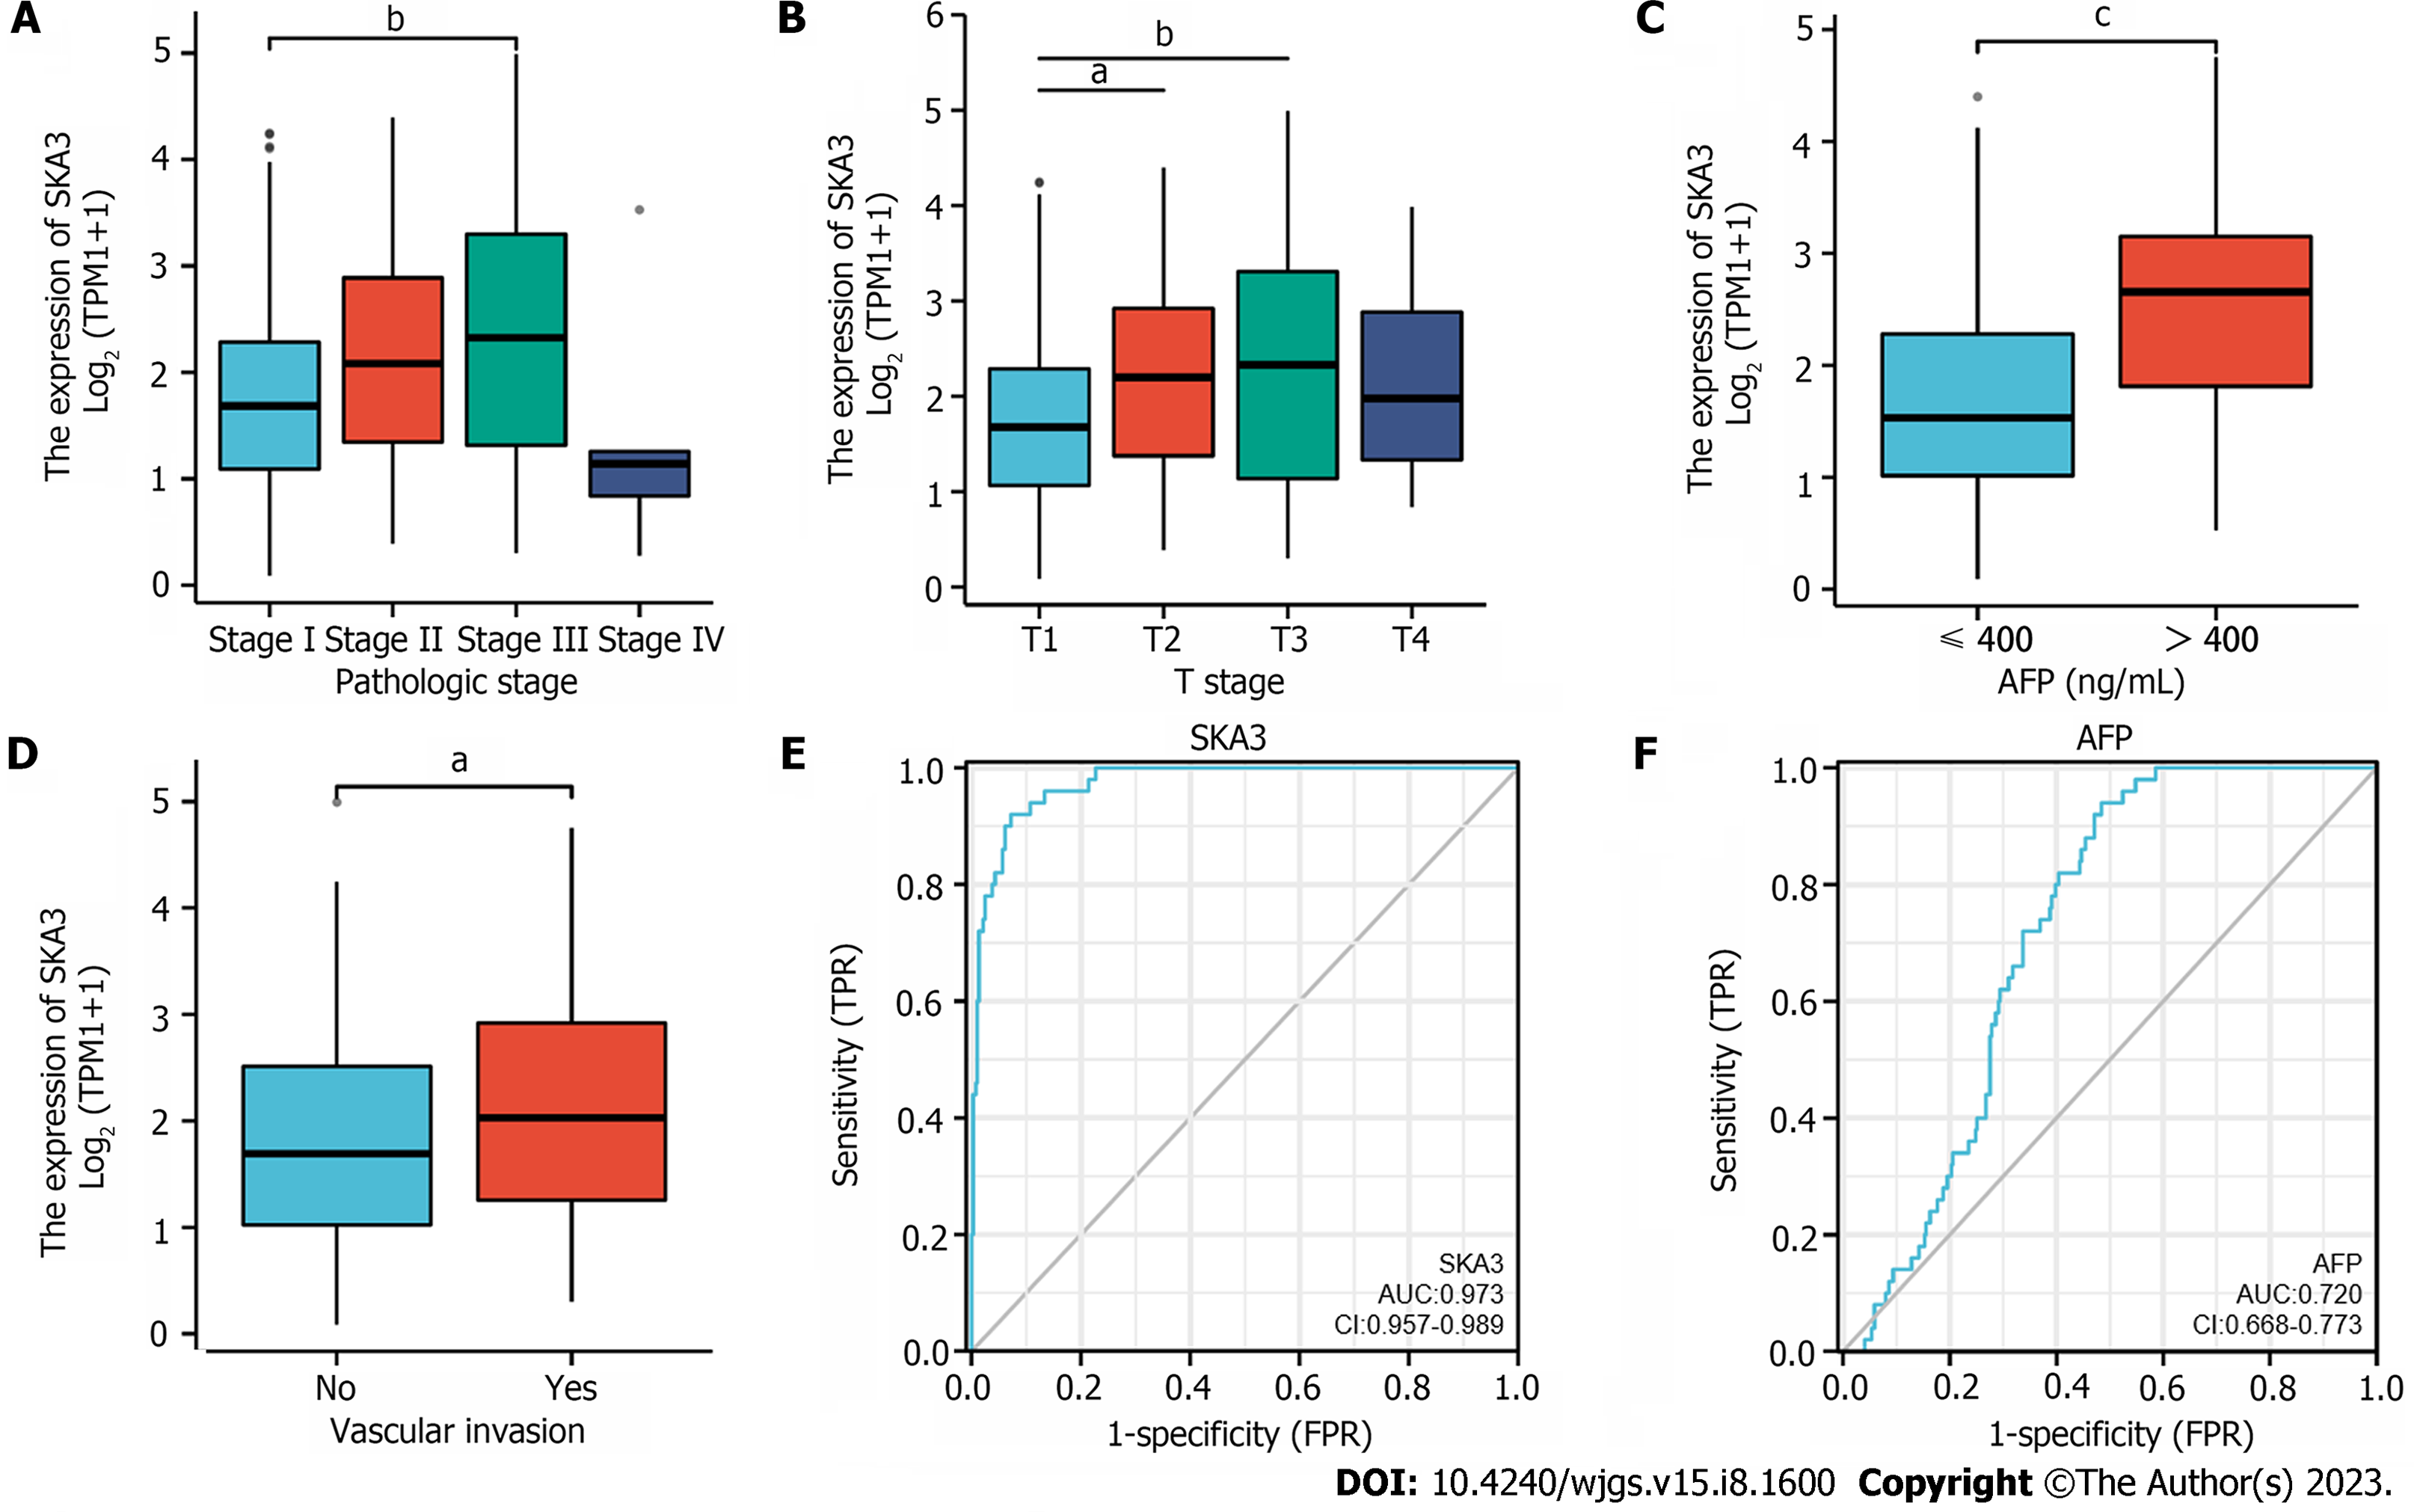
Figure 2 Relationship between spindle and kinetochore-associated complex subunit 3 expression and clinicopathological features.
A: Pathologic stage; B: T stage; C: Alpha fetoprotein (AFP) level; D: Vascular invasion; E and F: Receiver operating characteristic curve of spindle and kinetochore-associated complex subunit 3 expression (E) and AFP level (F) in hepatocellular carcinoma. SKA3: Spindle and kinetochore-associated complex subunit 3; AFP: Alpha fetoprotein; AUC: Area under the curves. aP < 0.05, bP < 0.01, cP < 0.001.
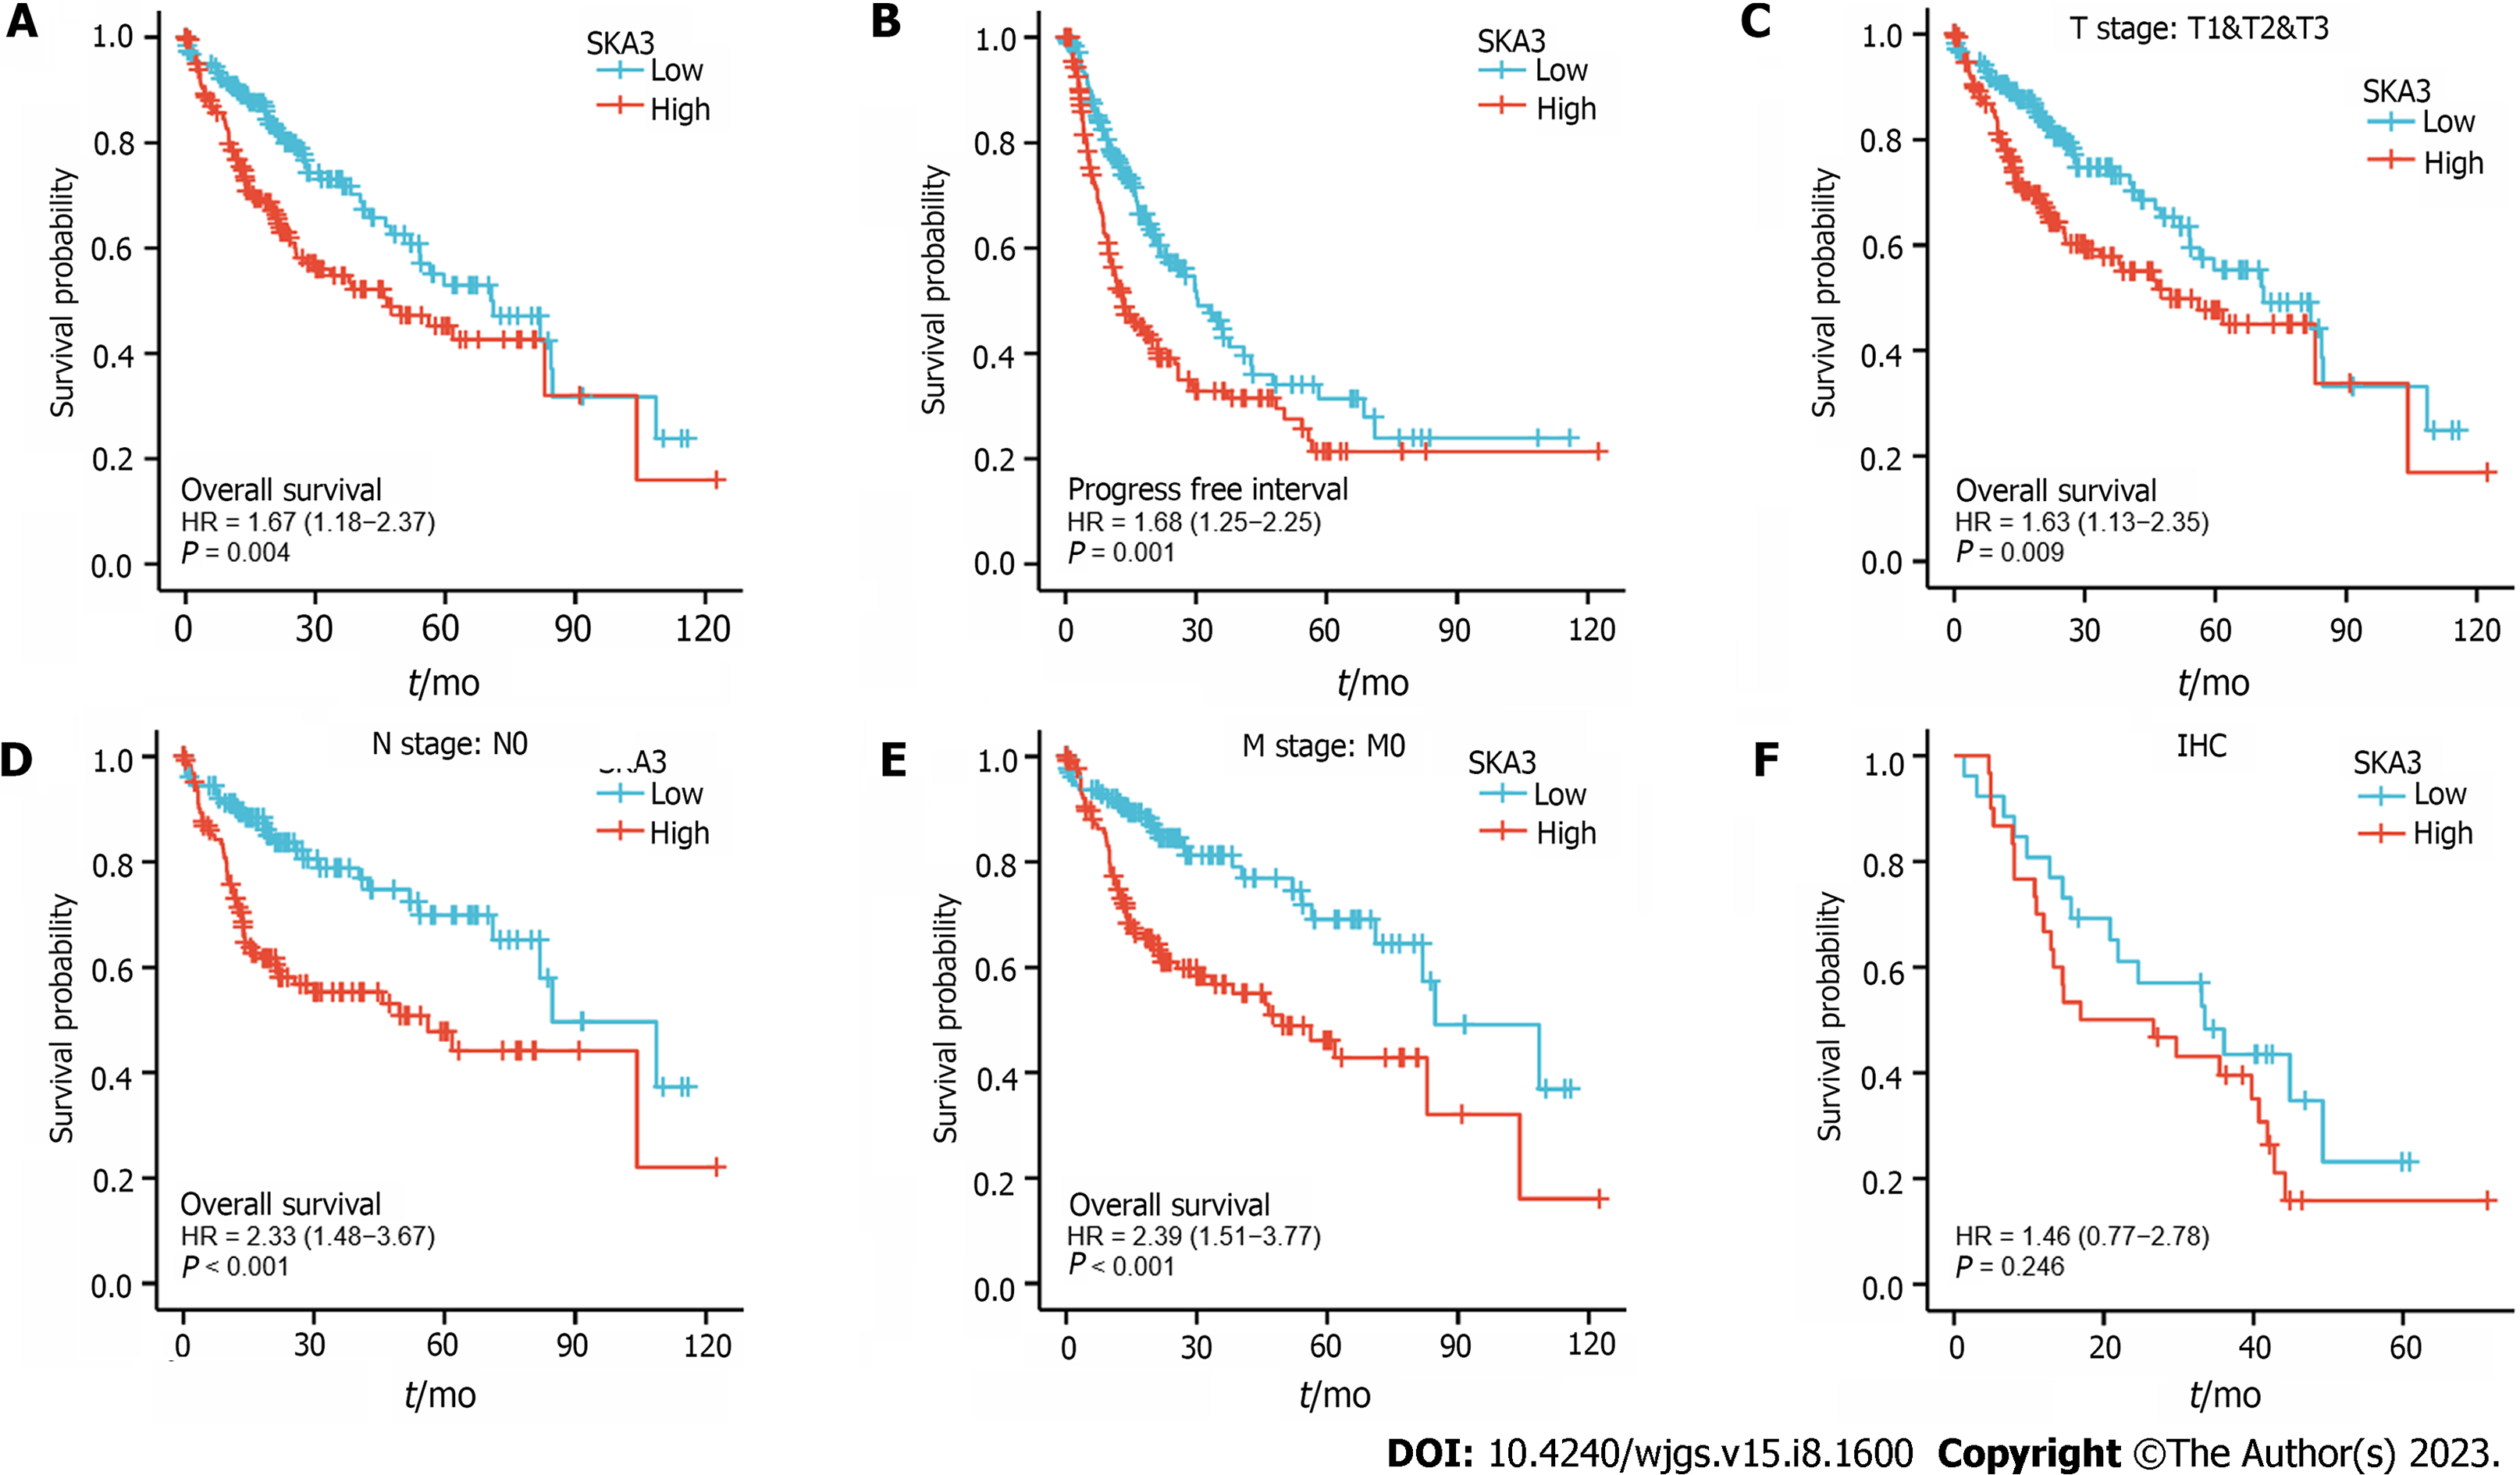
Figure 3 Kaplan Meier survival curves of hepatocellular carcinoma patients in the spindle and kinetochore-associated complex subunit 3 high- and low-expression groups.
A: Overall survival (OS); B: Progression-free interval; C-E: OS for subgroup analysis based on T stage (C), N stage (D), and M stage (E); F: Immunohistochemistry staining results showing that high spindle and kinetochore-associated complex subunit 3 expression was associated with poor prognosis in hepatocellular carcinoma patients. SKA3: Spindle and kinetochore-associated complex subunit 3; HR: Hazard ratio; IHC: Immunohistochemistry.
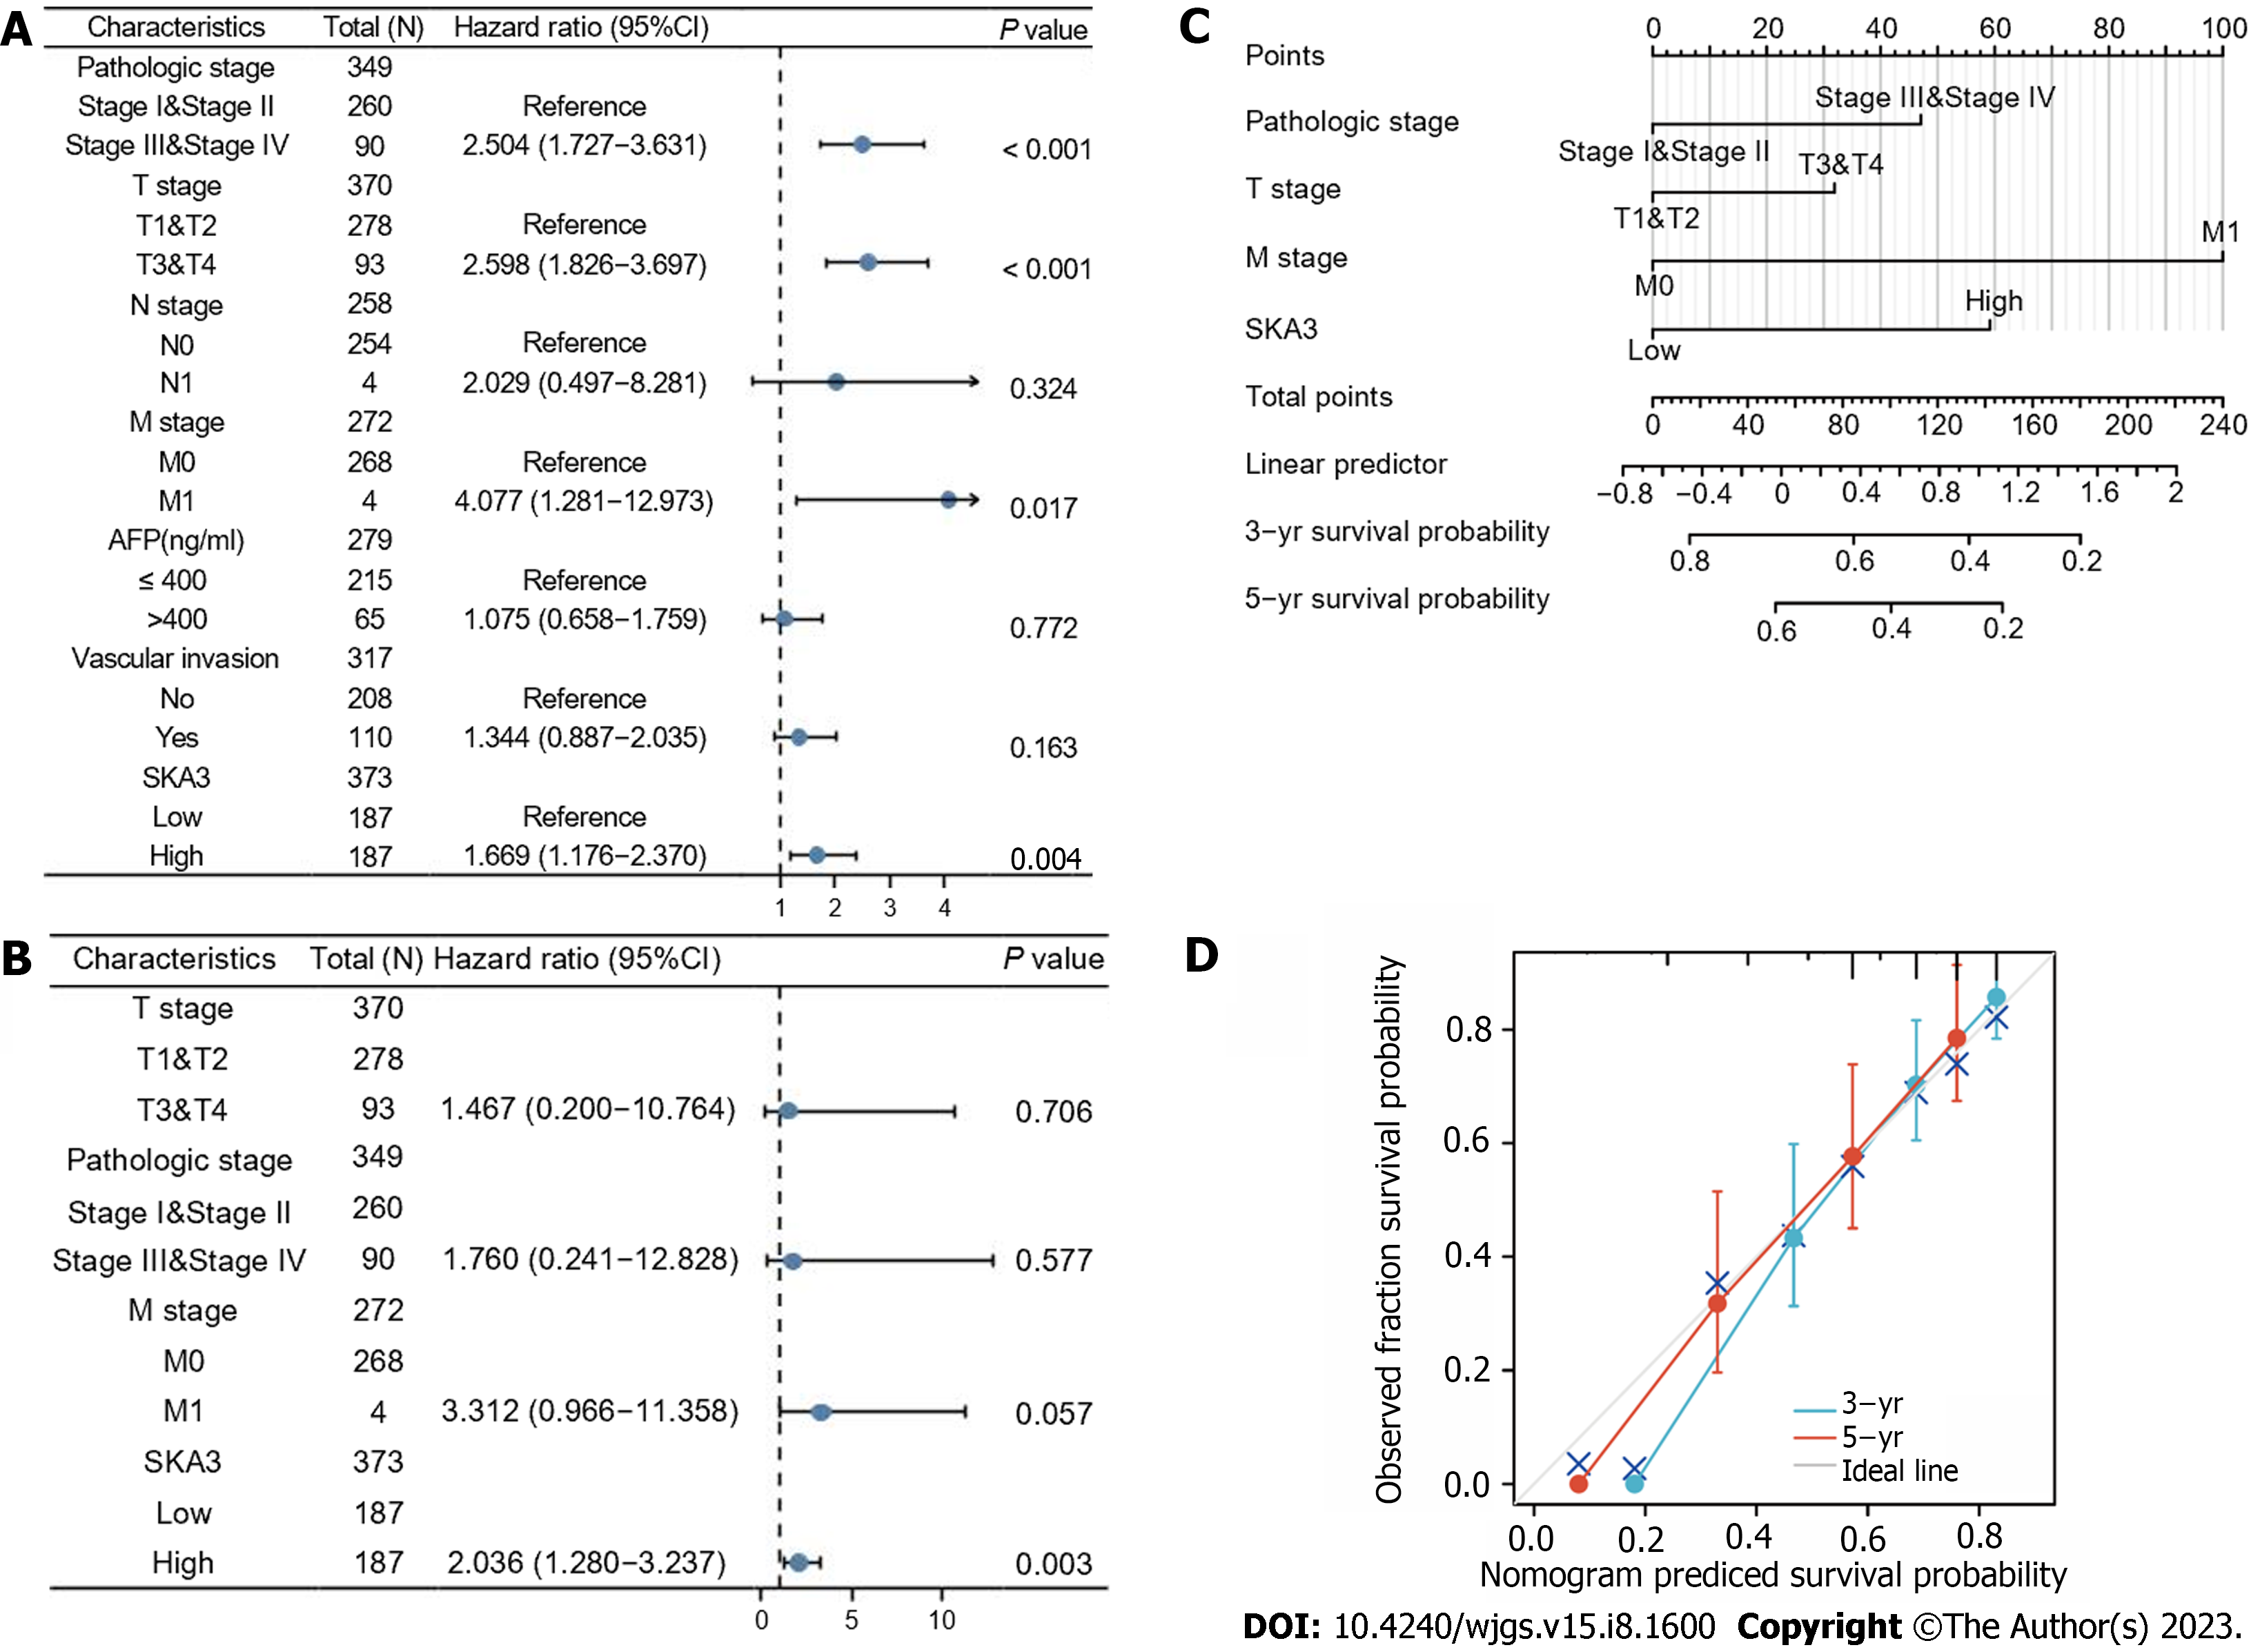
Figure 4 Construction of the nomogram.
A and B: Forest plot revealing the univariate and multivariate Cox analyses of overall survival (OS)-related variables; C: The nomogram incorporating the pathological stage, T stage, M stage and spindle and kinetochore-associated complex subunit 3 expression was identified as a predictor of the 3-, and 5-yr OS probabilities of hepatocellular carcinoma patients; D: Calibration curves of 3-, and 5-yr of OS. SKA3: Spindle and kinetochore-associated complex subunit 3; AFP: Alpha fetoprotein.
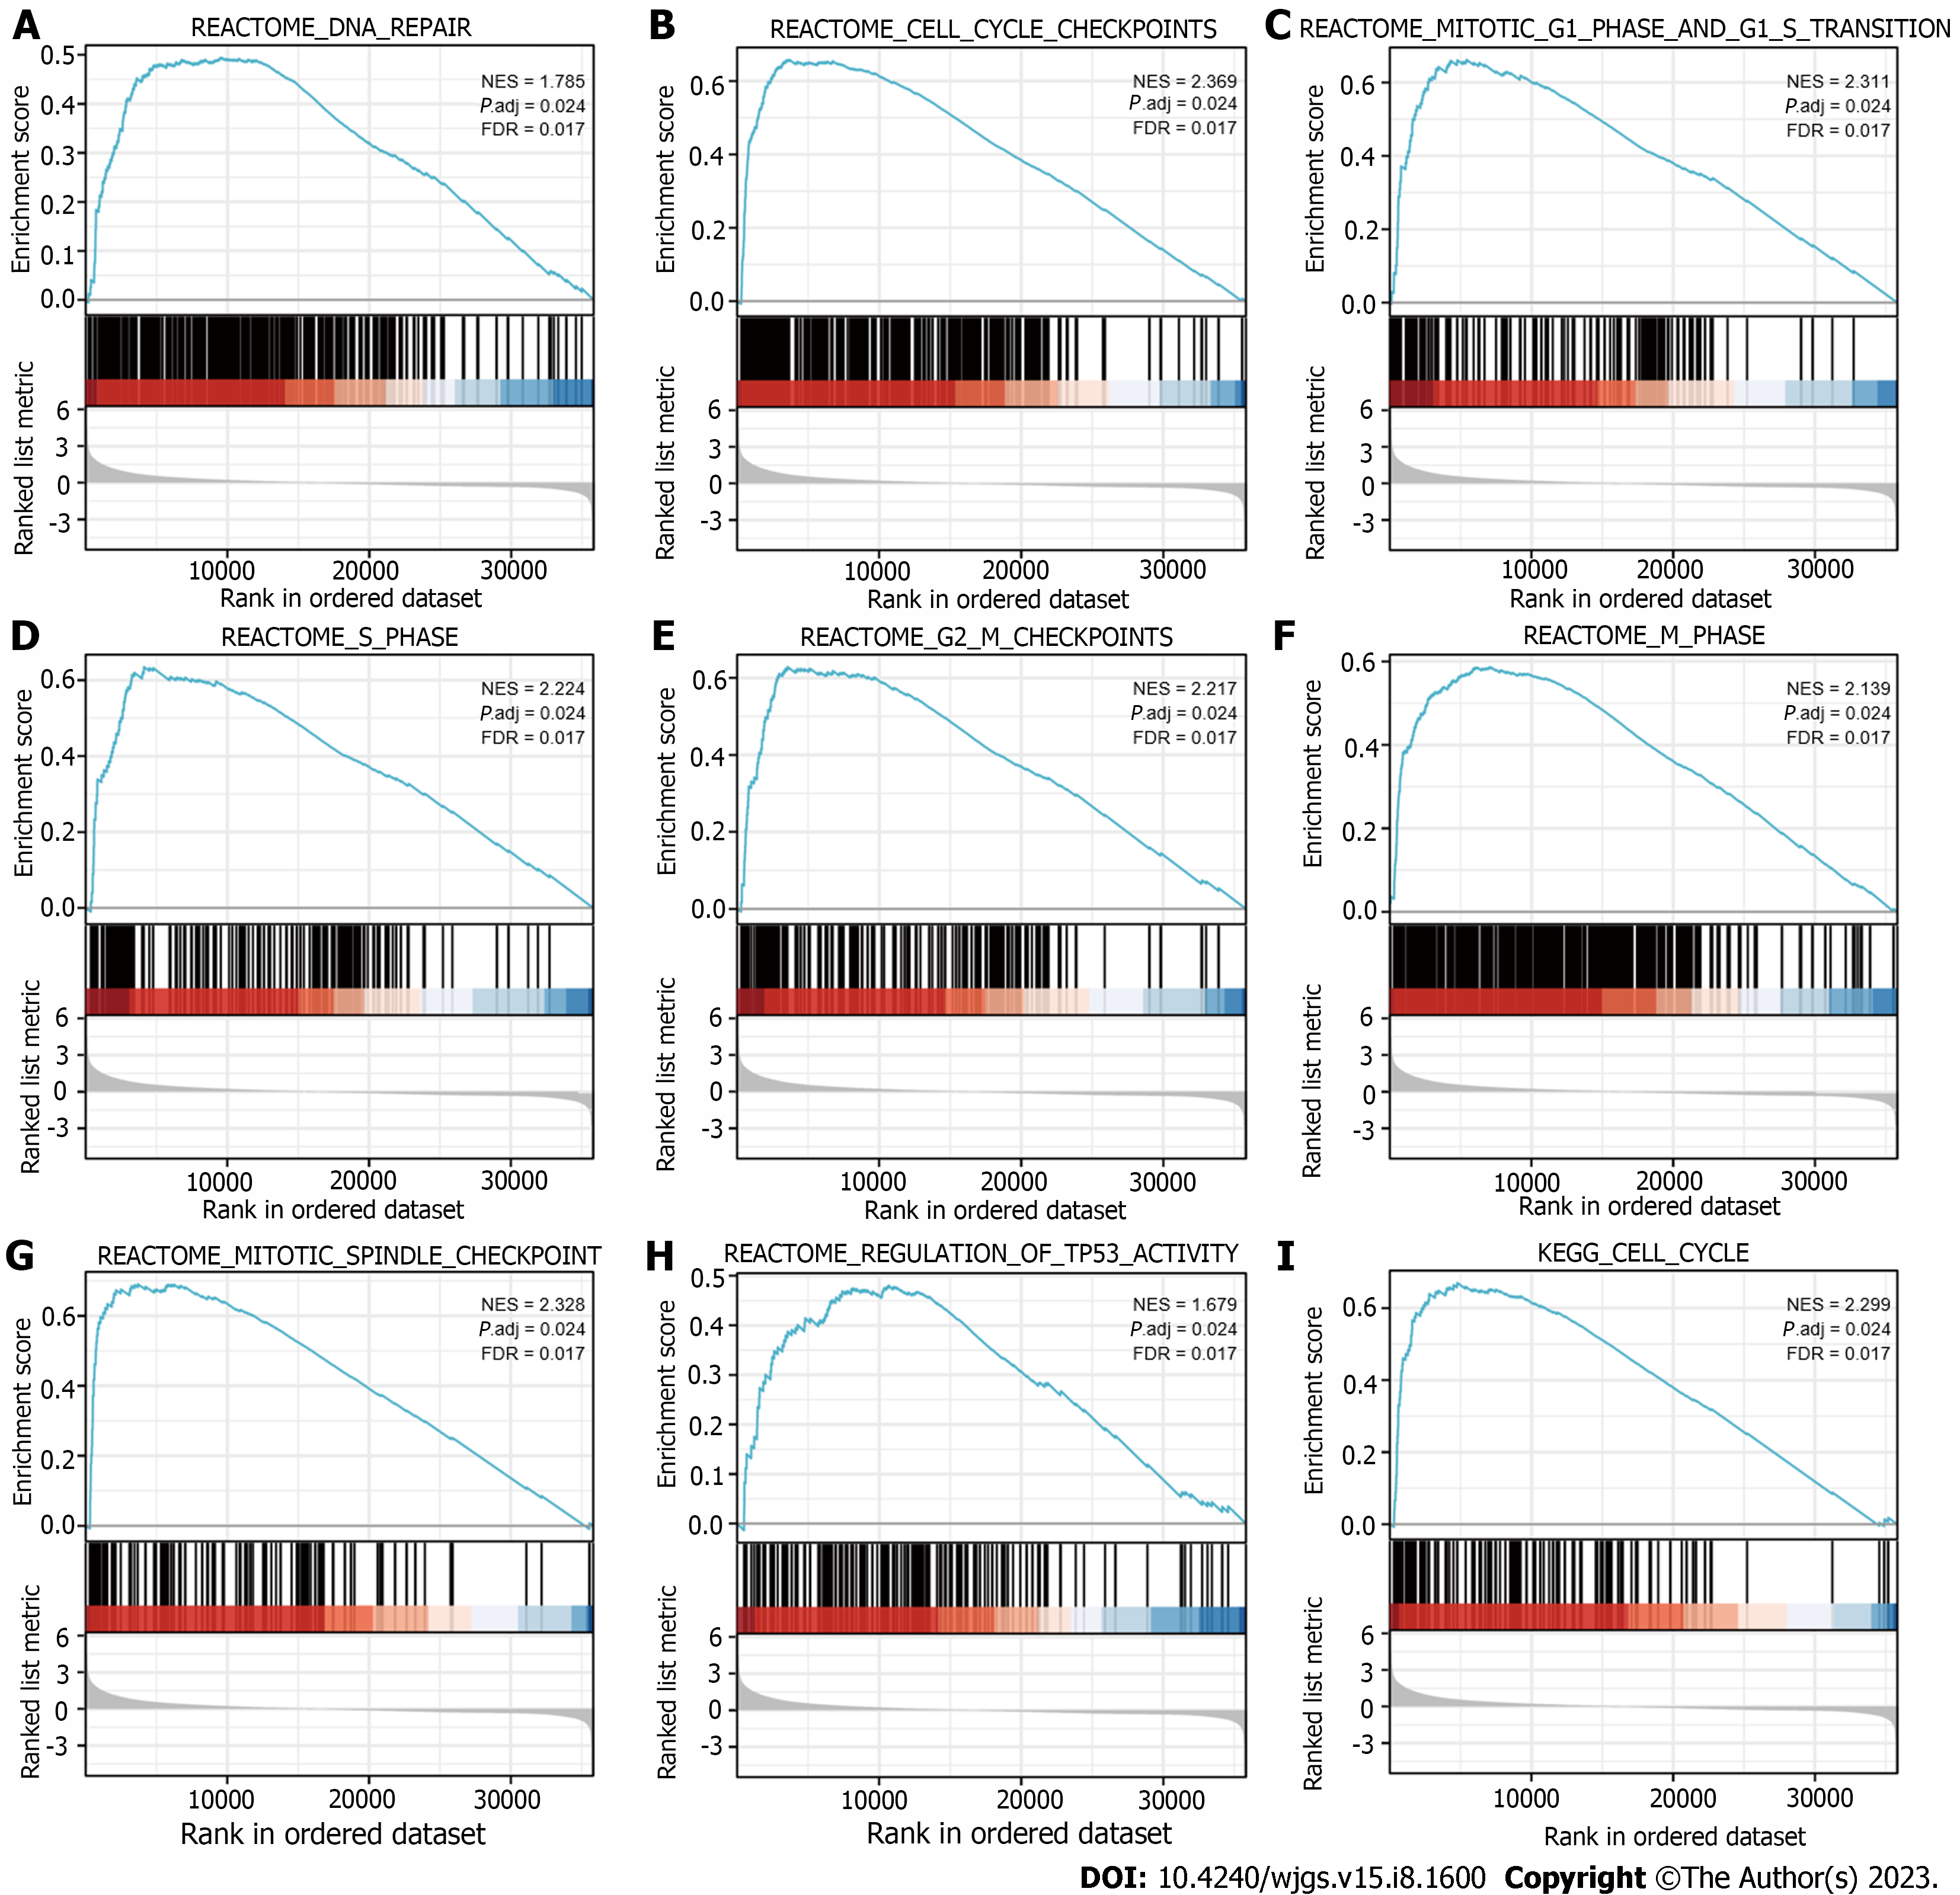
Figure 5 Analysis of spindle and kinetochore-associated complex subunit 3-related biological pathways by Gene Set Enrichment Analysis.
A: DNA repair; B: Cell cycle checkpoints; C: Mitotic G1 phase and G1-S transition; D: S phase; E: G2-M checkpoints; F: M phase; G: Mitotic spindle checkpoint; H: Regulation of TP53 activity; I: Cell cycle. SKA3: Spindle and kinetochore-associated complex subunit 3; GSEA: Gene Set Enrichment Analysis.
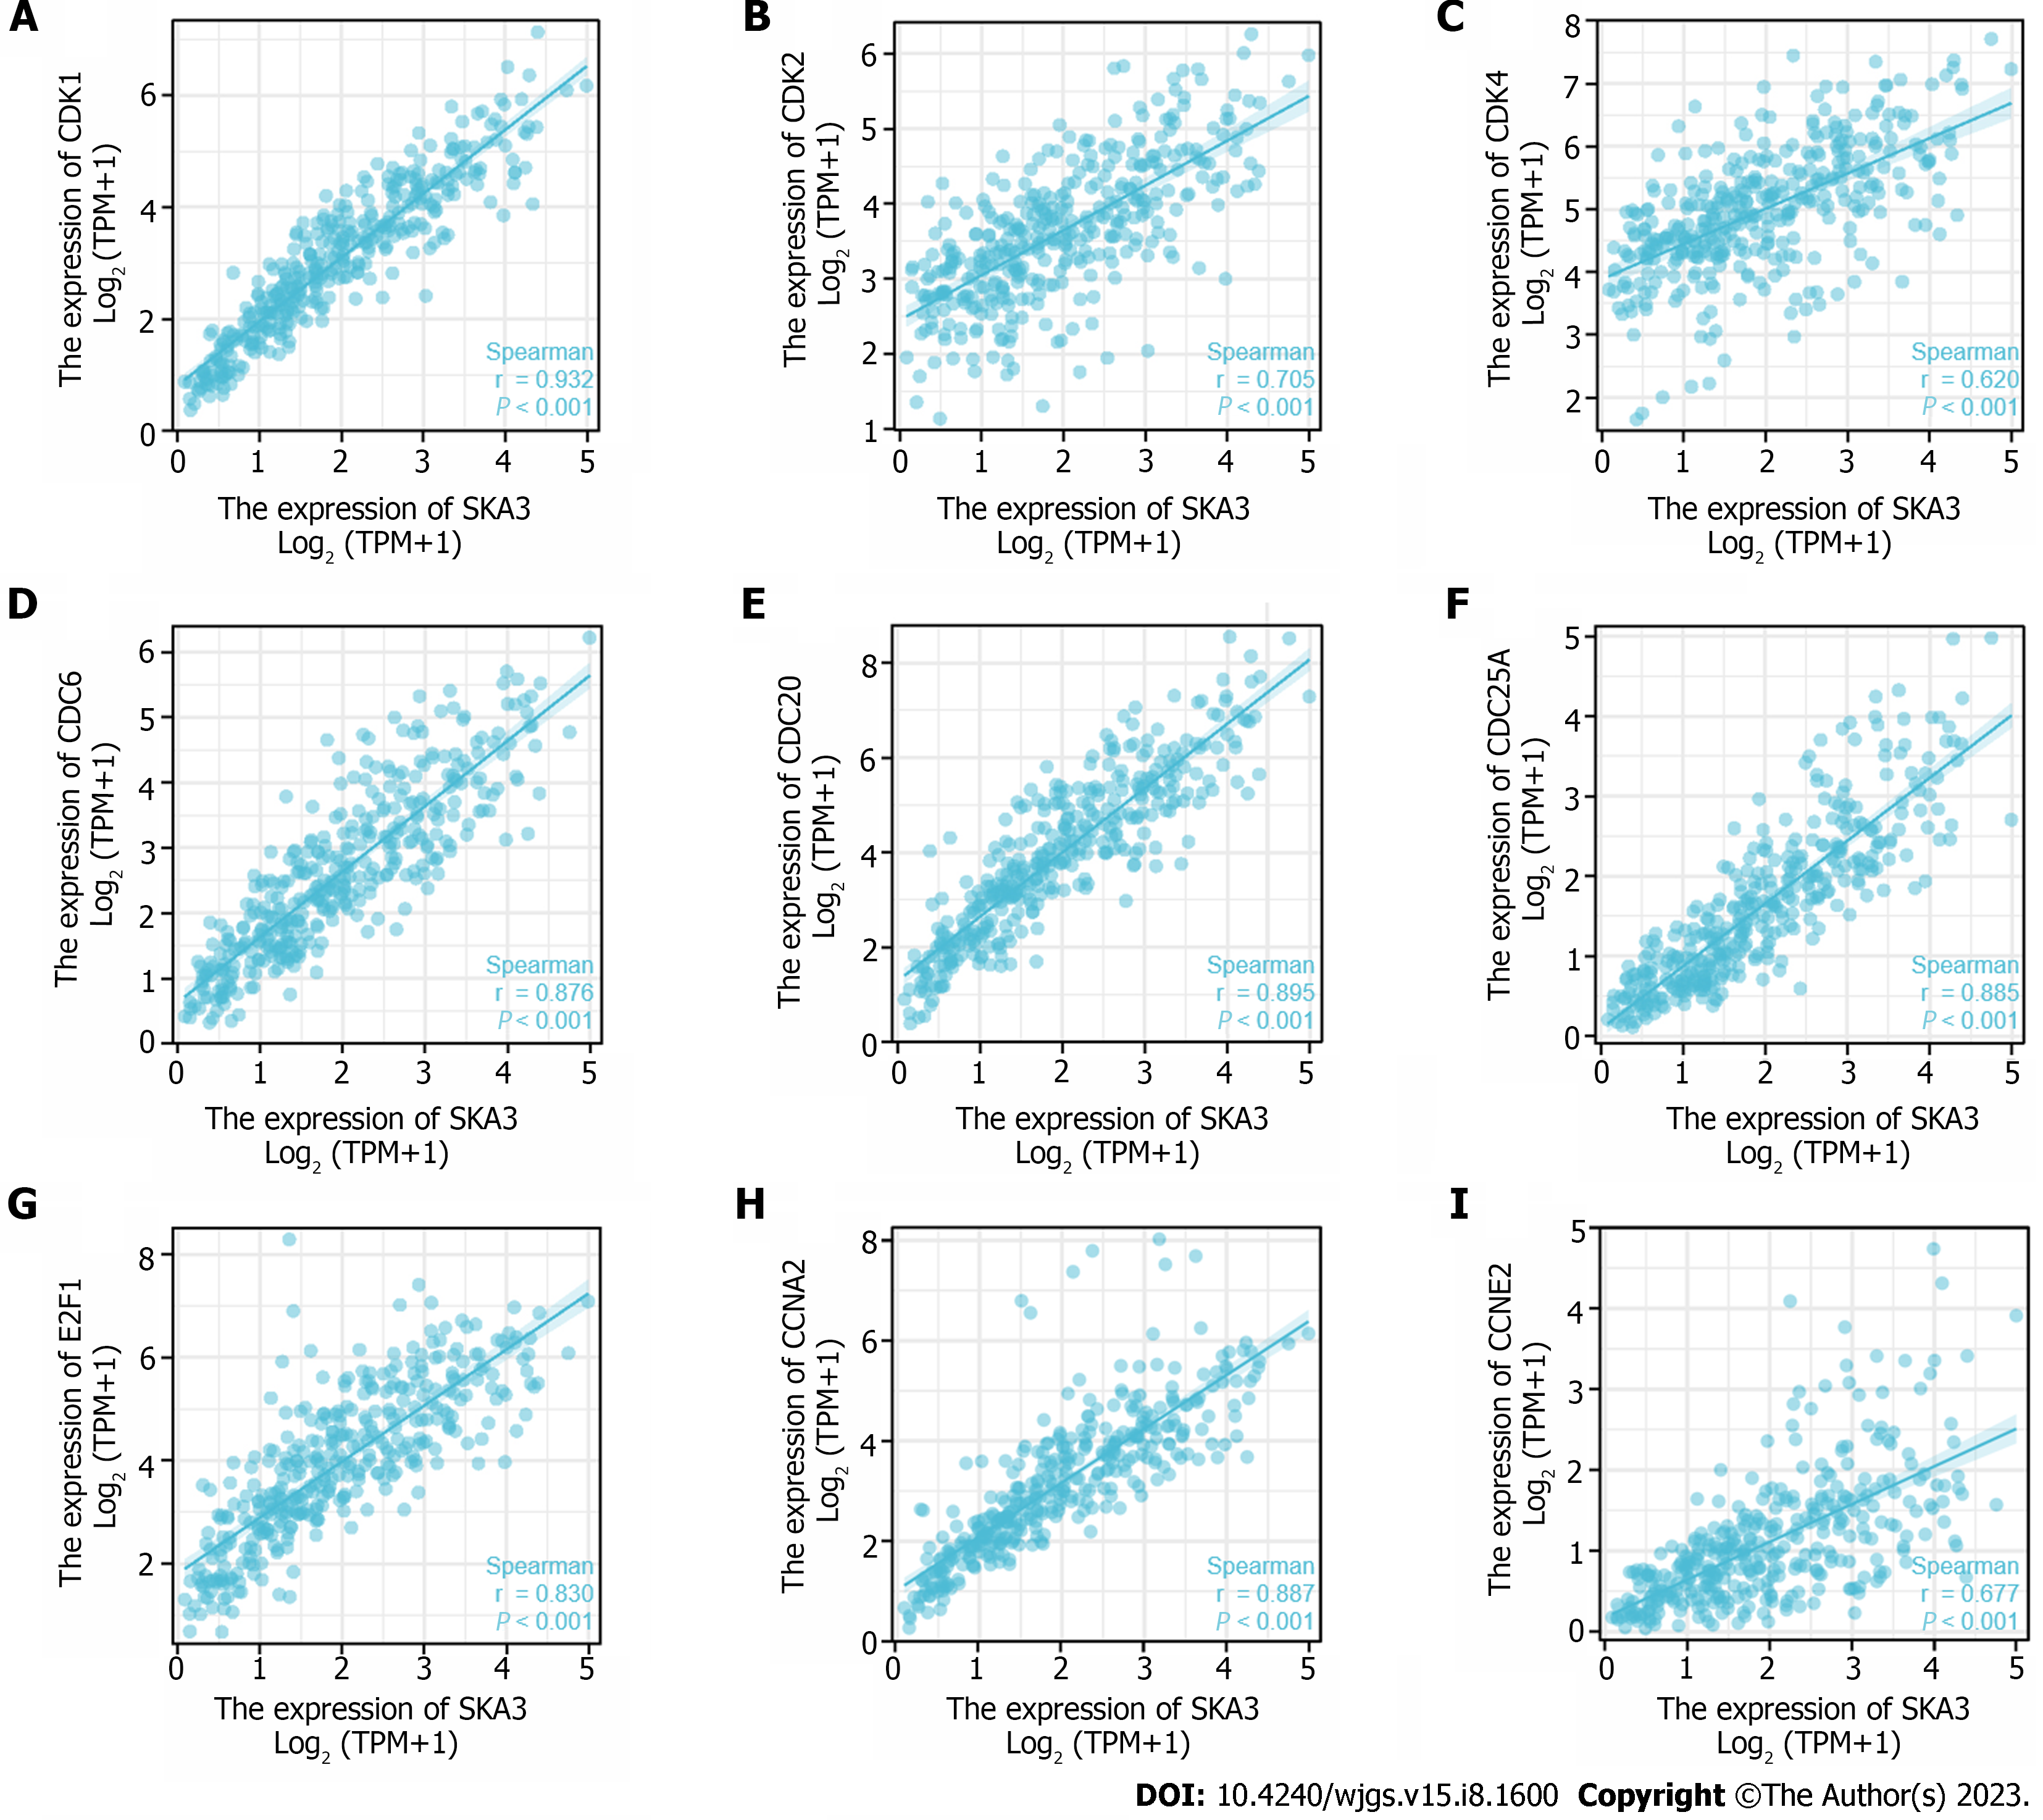
Figure 6 Correlation of spindle and kinetochore-associated complex subunit 3 expression with cell cycle-related molecules.
A: Cyclin-dependent kinase 1; B: Cyclin-dependent kinase 2; C: Cyclin-dependent kinase 4; D: Cell division cycle 6; E: Cell division cycle 20; F: Cell division cycle 25A; G: E2F transcription factor 1; H: Cyclin A2; I: Cyclin E2. SKA3: Spindle and kinetochore-associated complex subunit 3; CDK1: Cyclin-dependent kinase 1; CDK2: Cyclin-dependent kinase 2; CDK4: Cyclin-dependent kinase 4; CDC6: Cell division cycle 6; CDC20: Cell division cycle 20; CDC25A: Cell division cycle 25A; E2F1: E2F transcription factor 1; CCNA2: Cyclin A2; CCNE2: Cyclin E2.
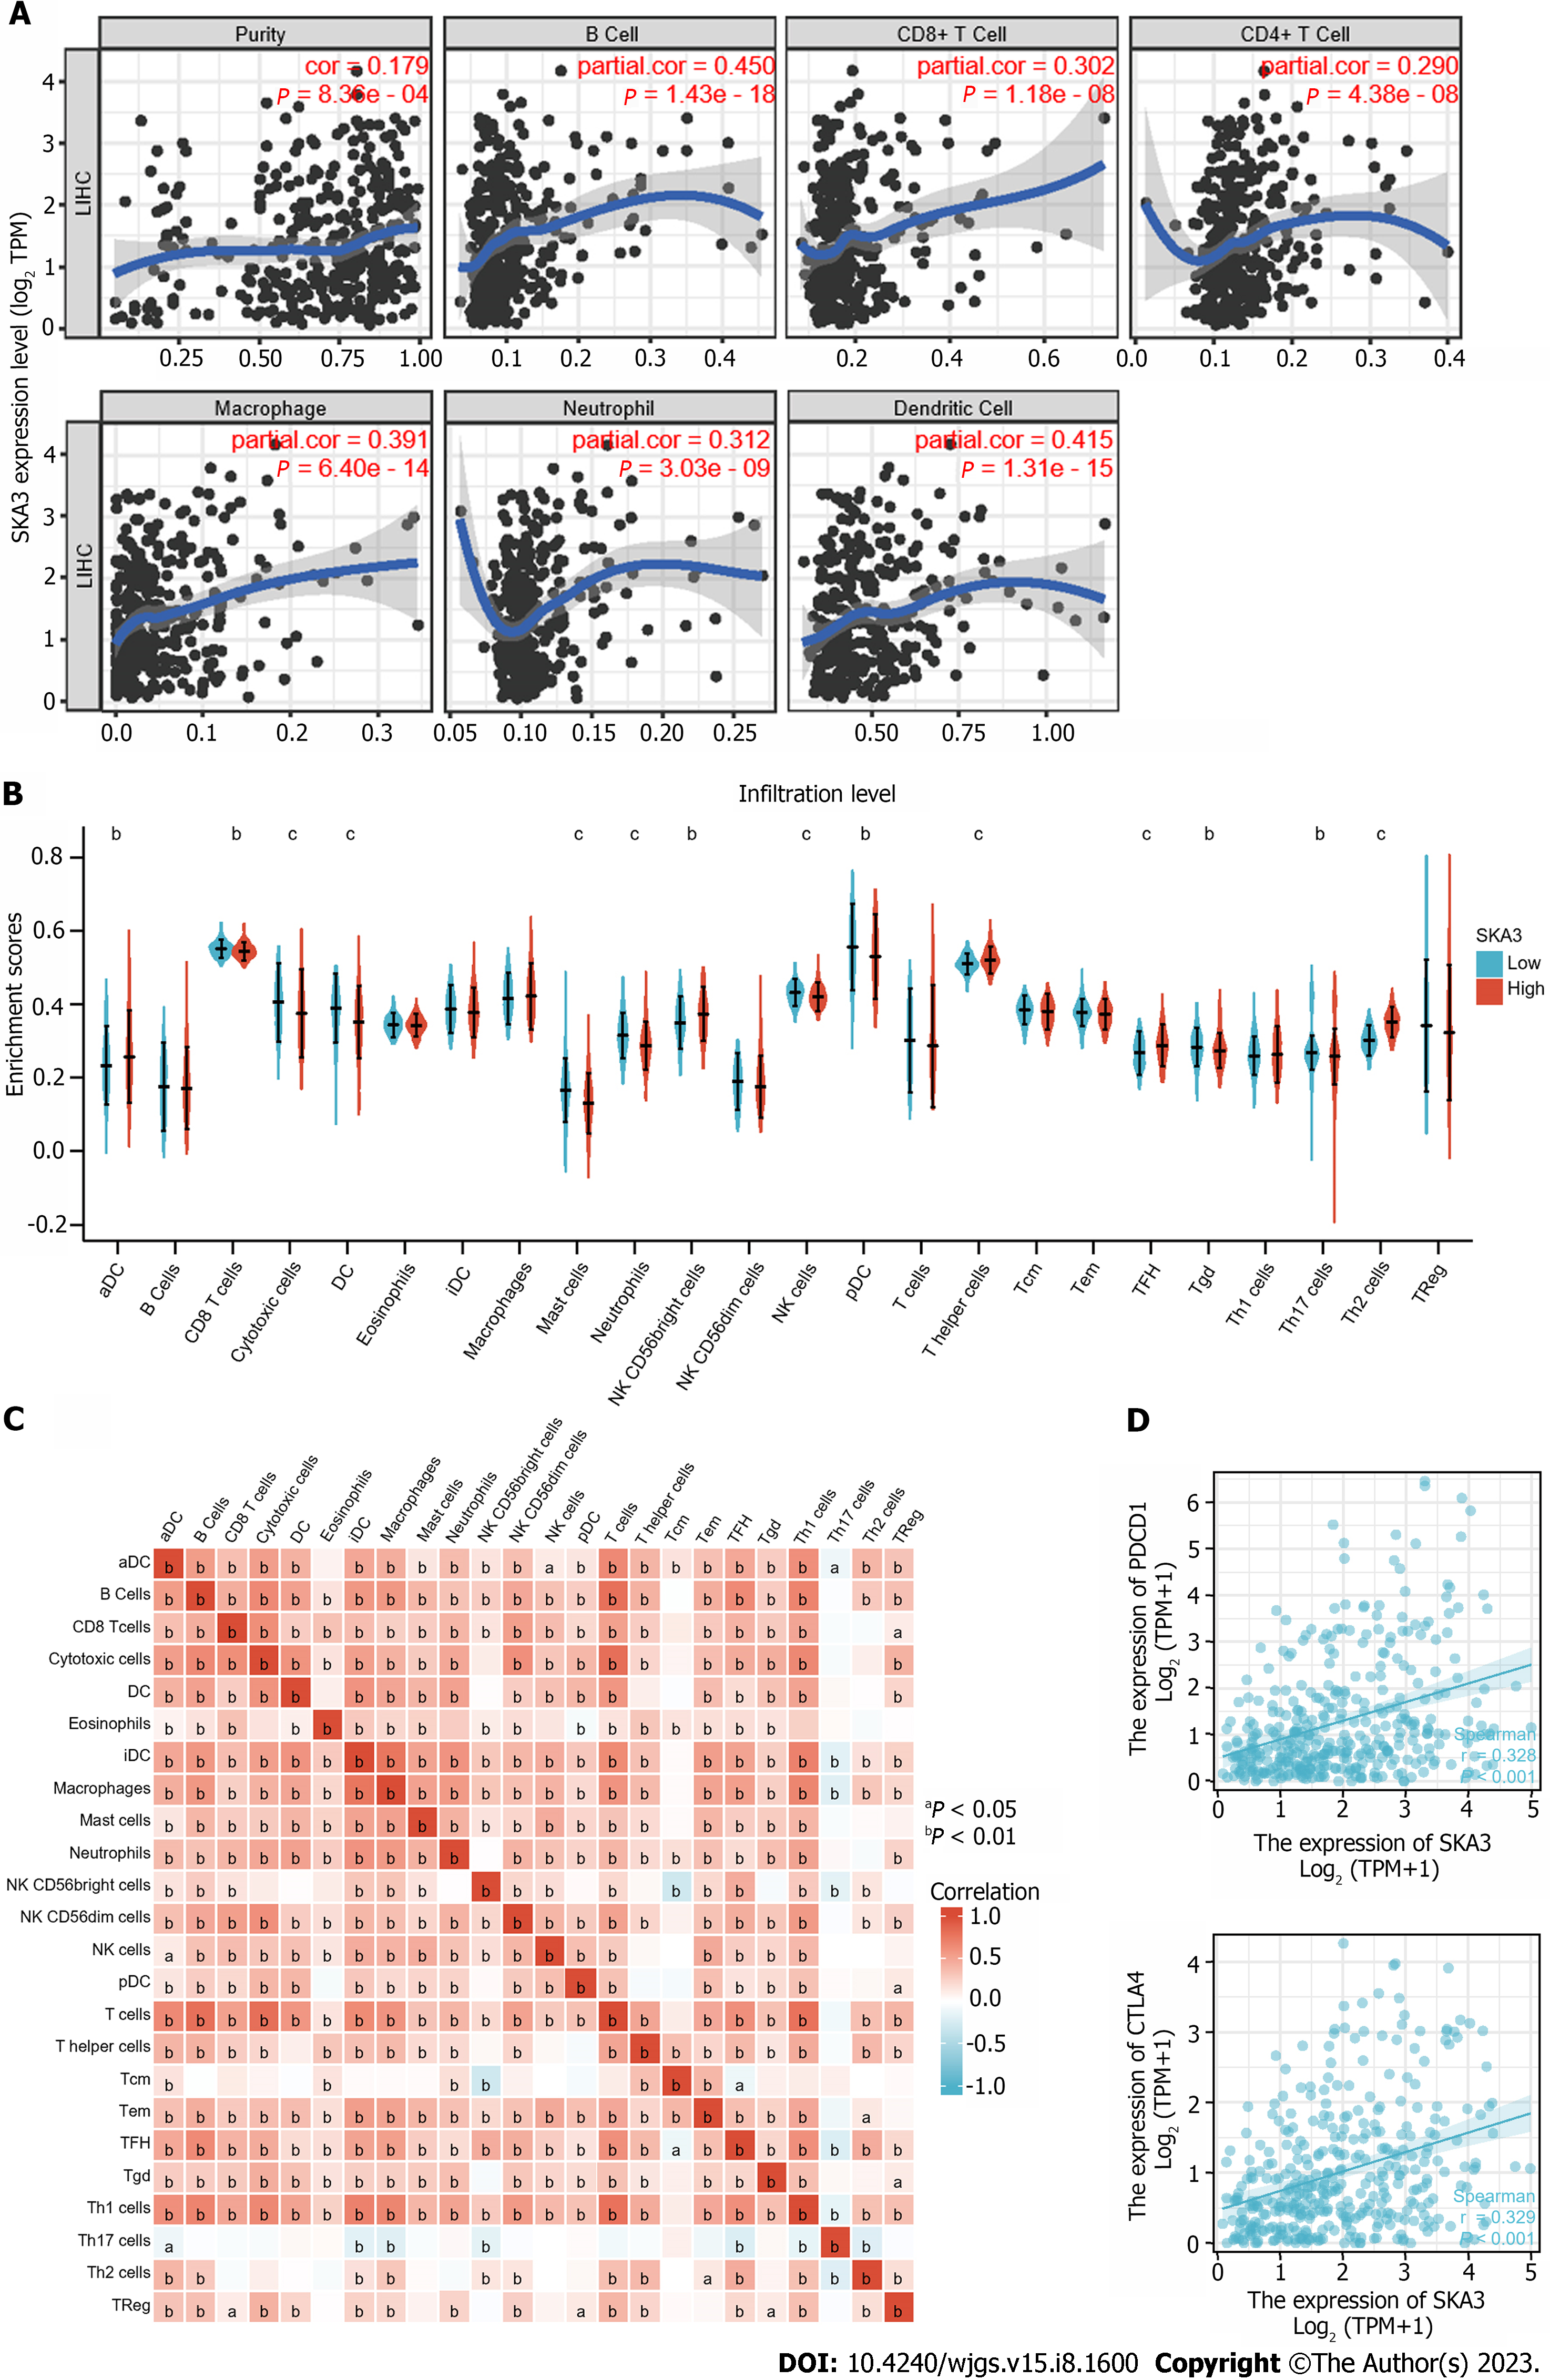
Figure 7 Association between the spindle and kinetochore-associated complex subunit 3 expression level and immune micro
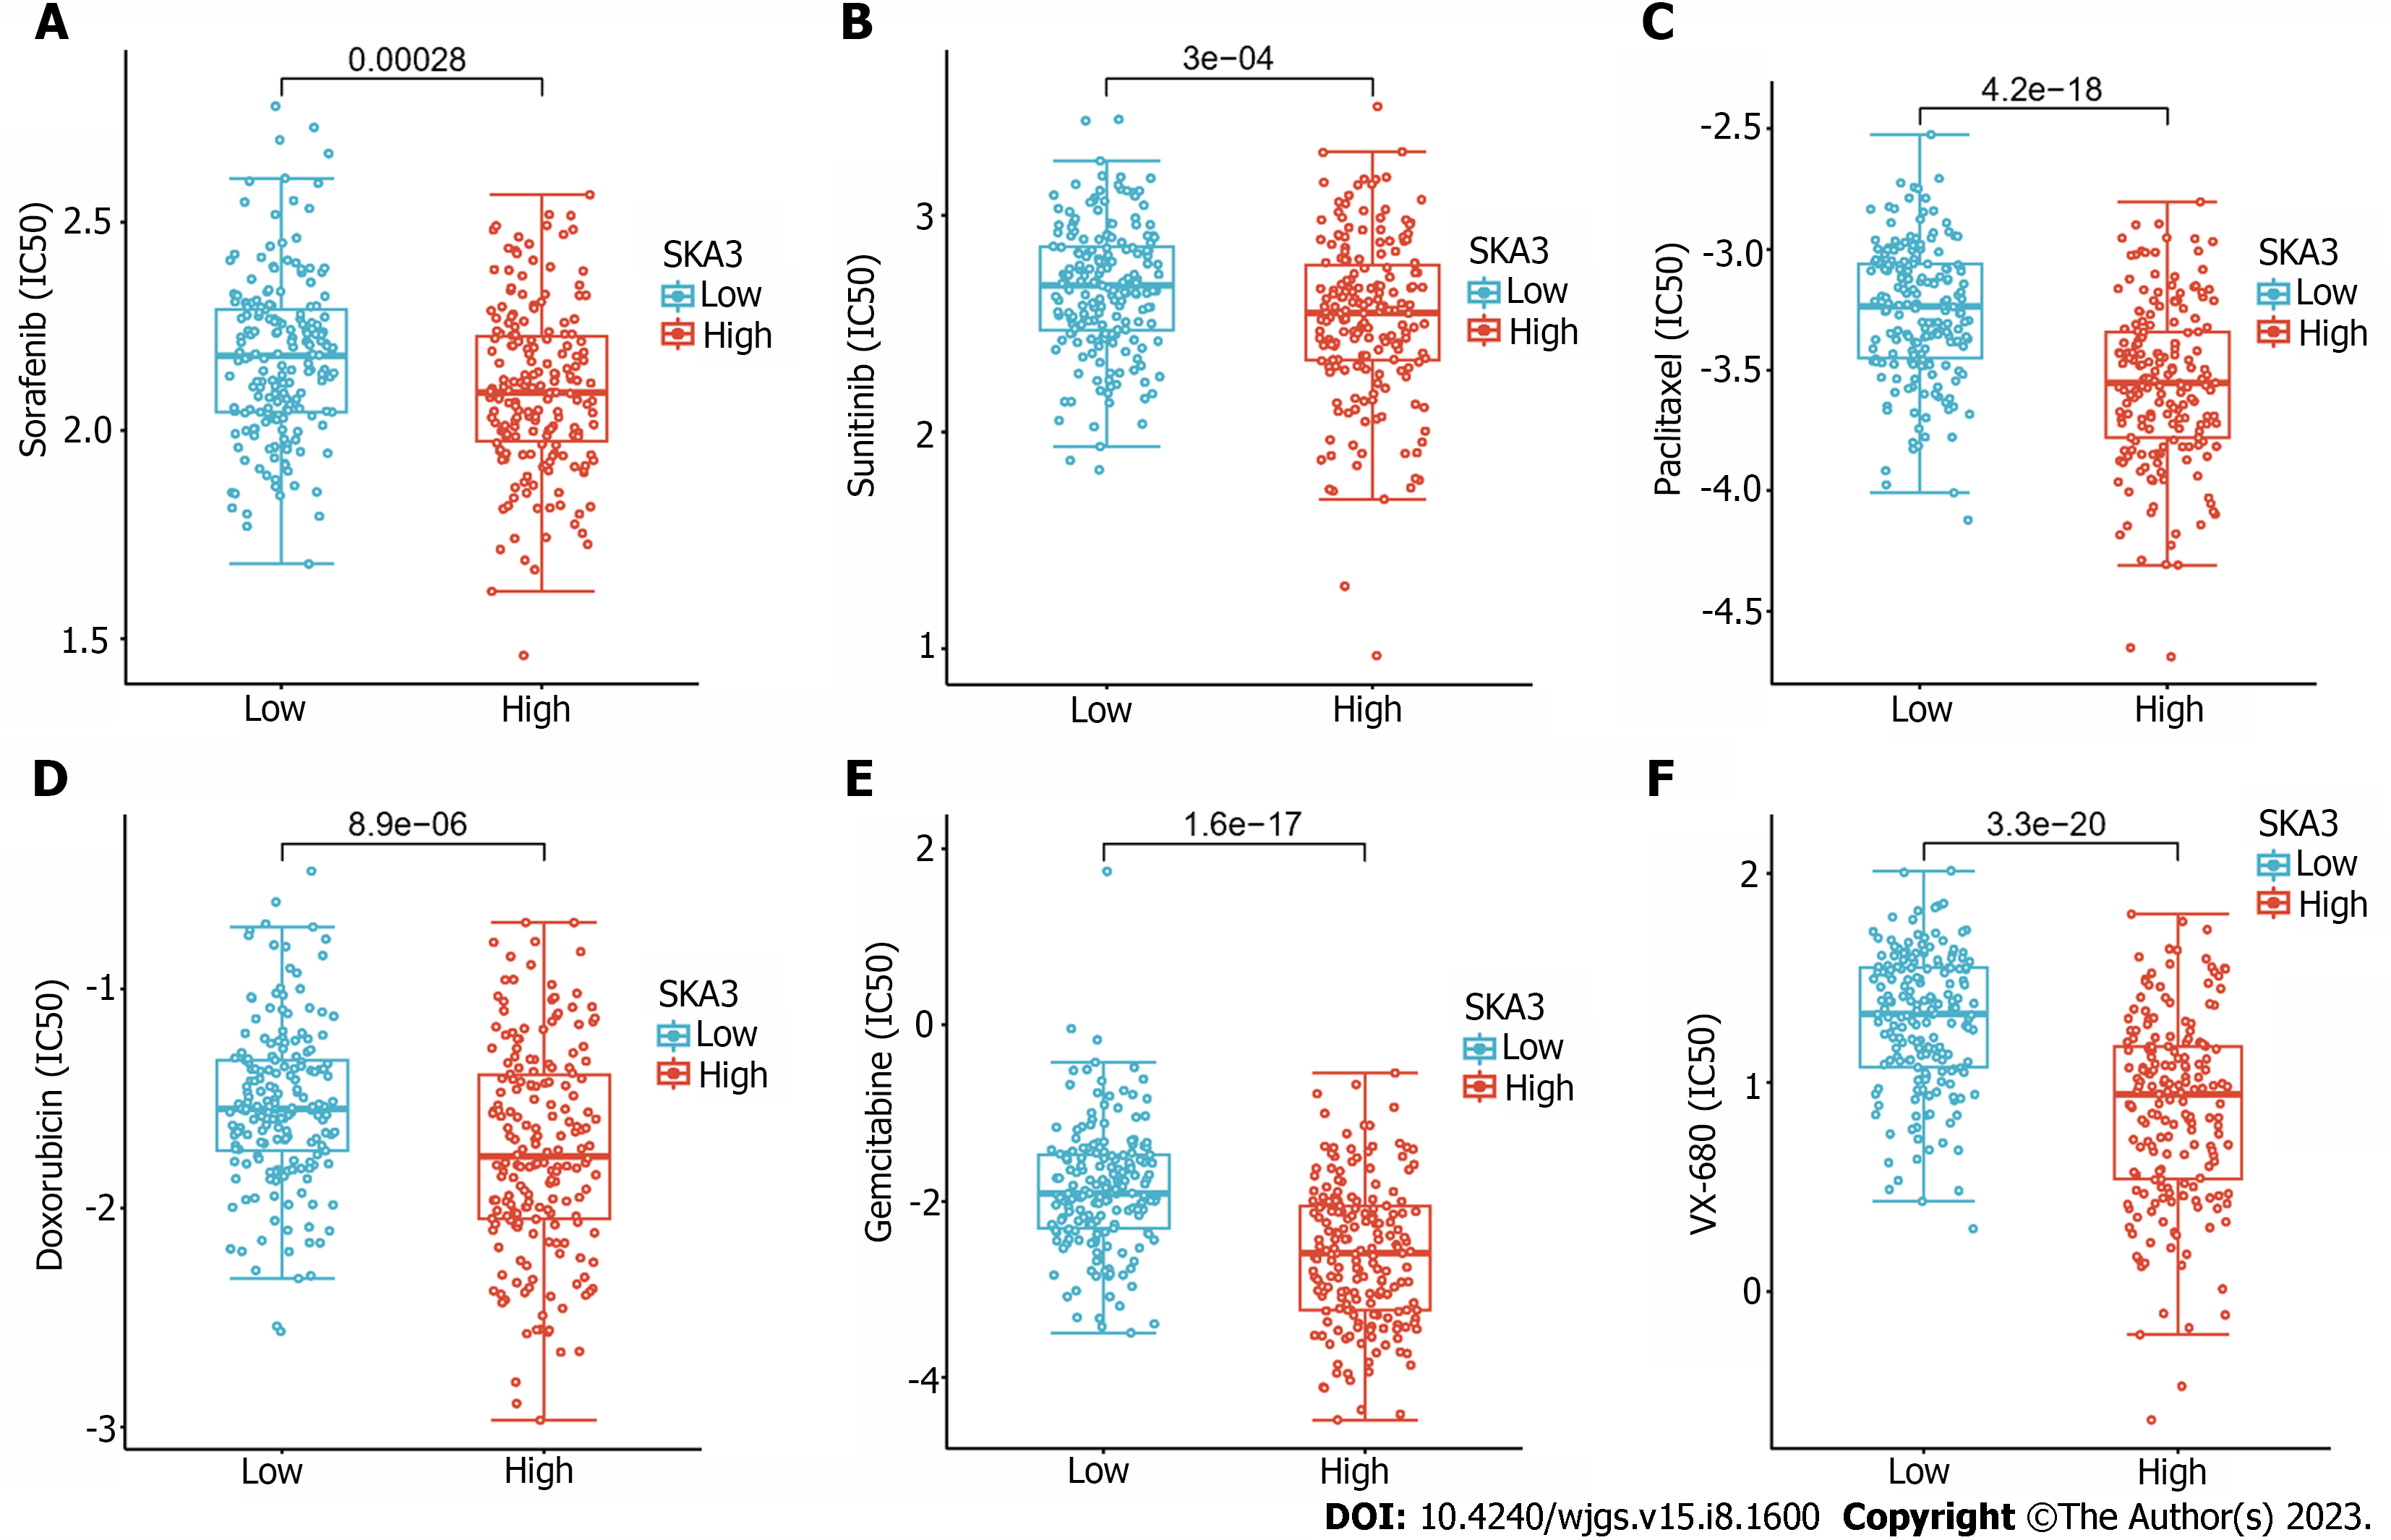
Figure 8 Half maximal inhibitory concentration of six commonly used chemotherapeutic drugs in groups with high and low expression of spindle and kinetochore-associated complex subunit 3.
A: Sorafenib; B: Sunitinib; C: Paclitaxel; D: Doxorubicin; E: Gemcitabine; F: Vx-680. IC50: Half maximal inhibitory concentration; SKA3: Spindle and kinetochore-associated complex subunit 3.
- Citation: Zheng LL, Wang YR, Liu ZR, Wang ZH, Tao CC, Xiao YG, Zhang K, Wu AK, Li HY, Wu JX, Xiao T, Rong WQ. High spindle and kinetochore-associated complex subunit-3 expression predicts poor prognosis and correlates with adverse immune infiltration in hepatocellular carcinoma. World J Gastrointest Surg 2023; 15(8): 1600-1614
- URL: https://www.wjgnet.com/1948-9366/full/v15/i8/1600.htm
- DOI: https://dx.doi.org/10.4240/wjgs.v15.i8.1600


