Copyright
©The Author(s) 2023.
World J Gastrointest Surg. Nov 27, 2023; 15(11): 2430-2444
Published online Nov 27, 2023. doi: 10.4240/wjgs.v15.i11.2430
Published online Nov 27, 2023. doi: 10.4240/wjgs.v15.i11.2430
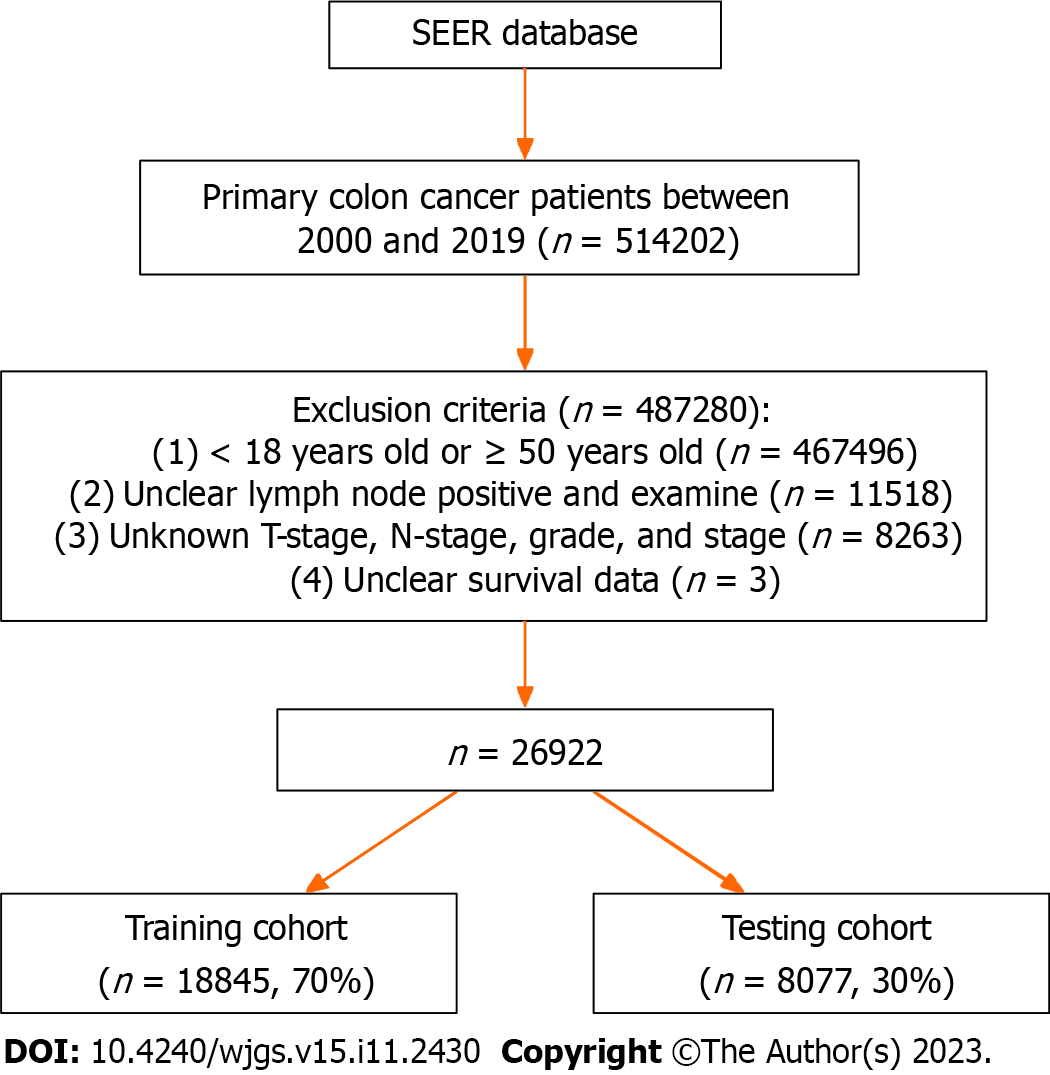
Figure 1 The flowchart of data collection and grouping for early-onset colon cancer patients.
26922 patients with ECC after radical resection of colon cancer were enrolled and randomly divided into a training group (n = 18845, 70%) and a testing group (n = 8077, 30%).
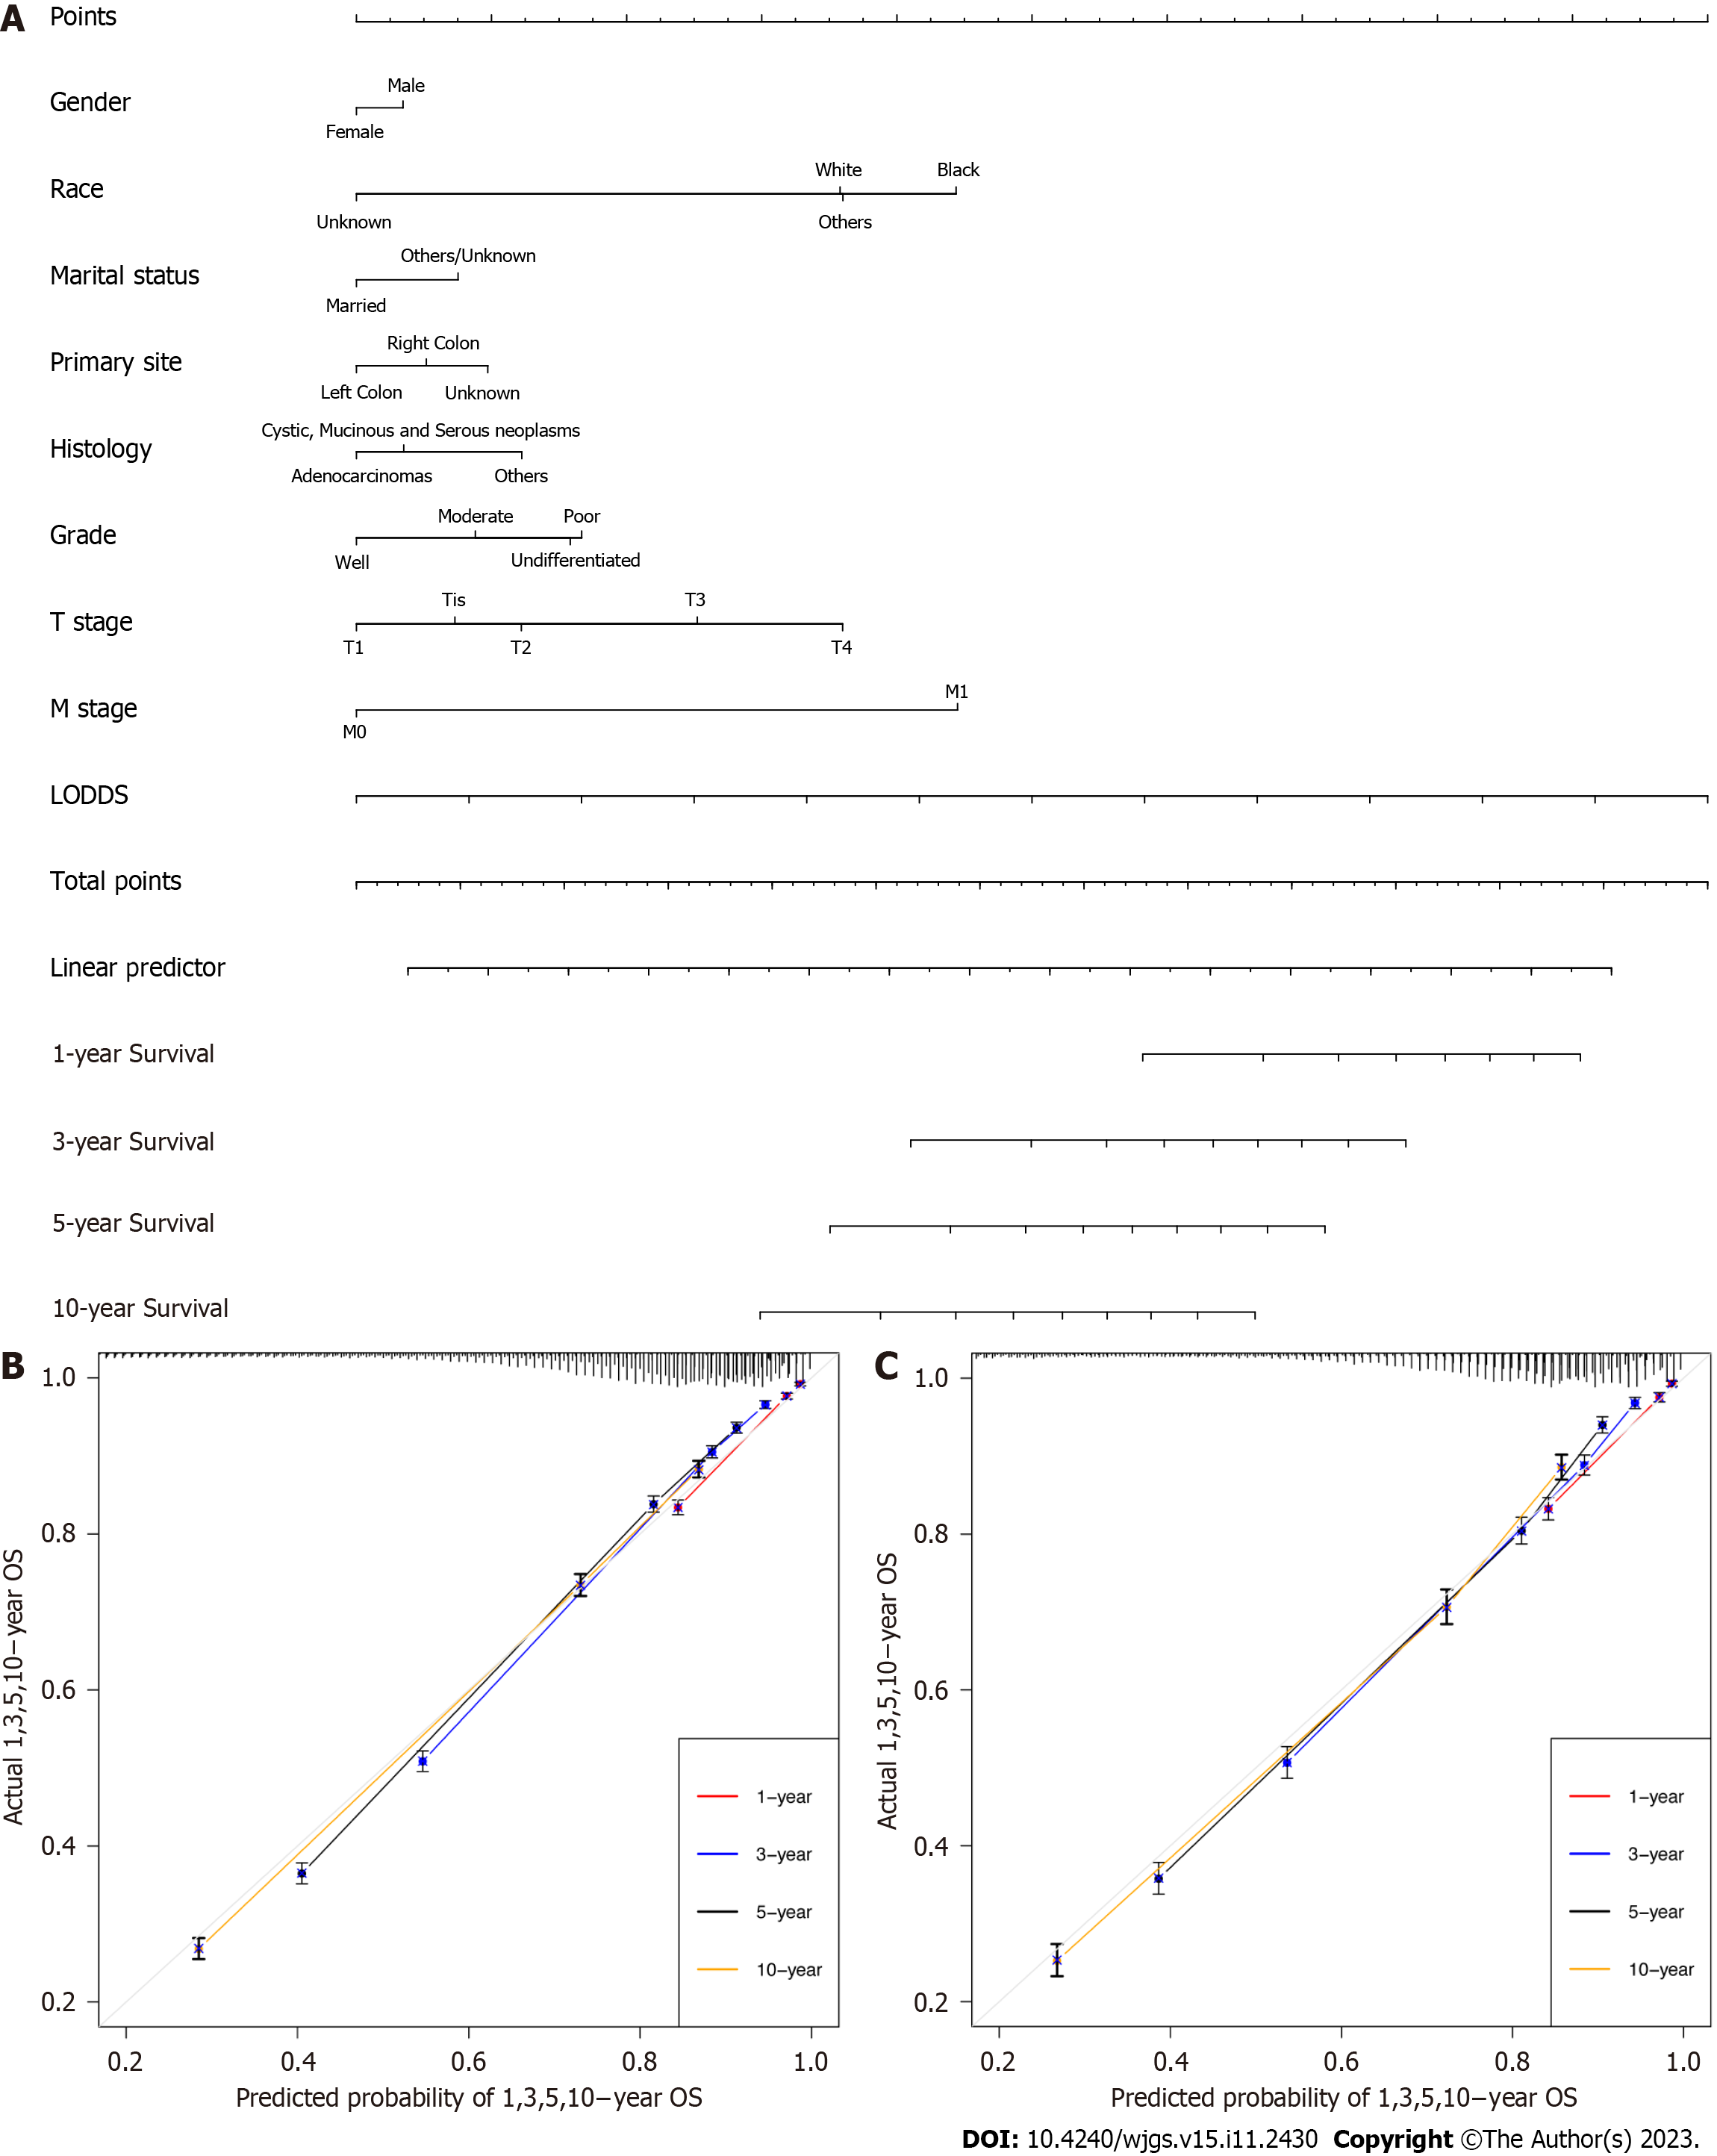
Figure 2 Nomogram for overall survival of early-onset colon cancer patients.
A: Prediction for 1-, 3-, 5- and 10-year overall survival of nomogram; B and C: Calibration plots for 1-, 3- 5- and 10-year in training (B), internal validation (C). LODDS: Log odds of positive lymph node; OS: Overall survival.
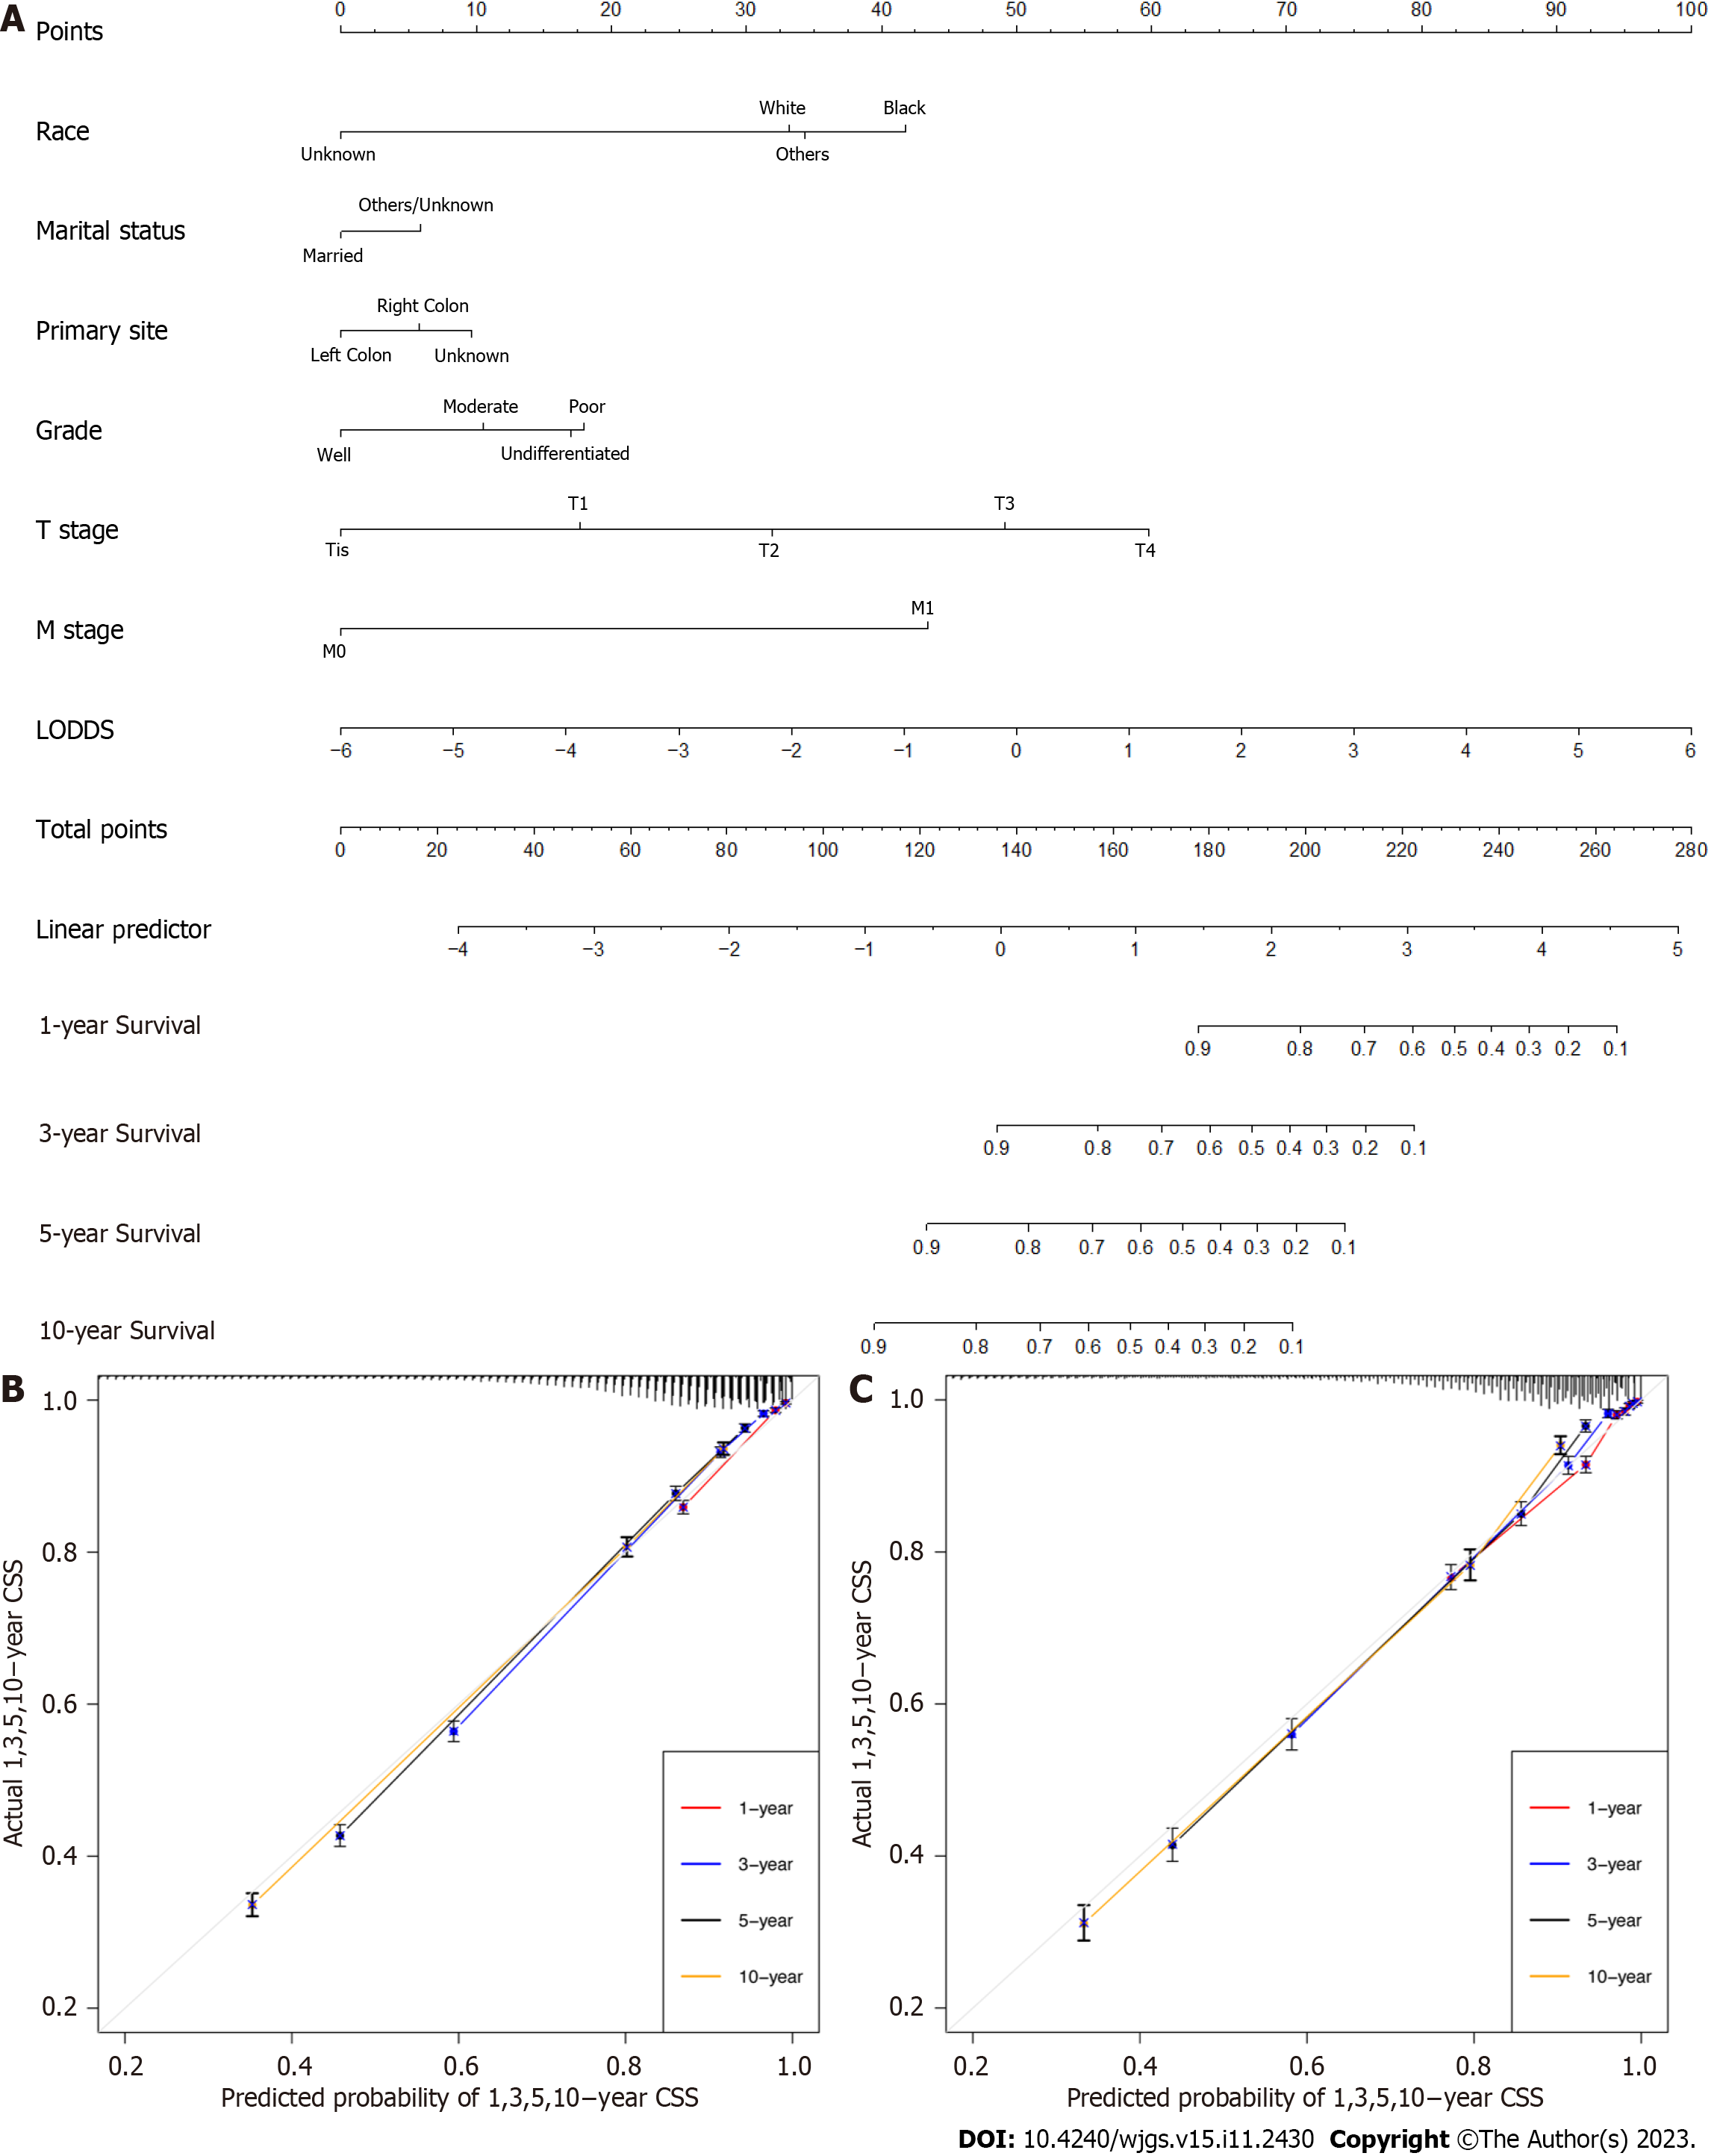
Figure 3 Nomogram for cause-specific survival of early-onset colon cancer patients.
A: Prediction for 1-, 3-, 5- and 10-year cause-specific survival of the nomogram; B and C: Calibration plots for 1-, 3- 5- and 10-year in training (B), internal validation (C). ECC: LODDS: Log odds of positive lymph node; CSS: Cause-specific survival.
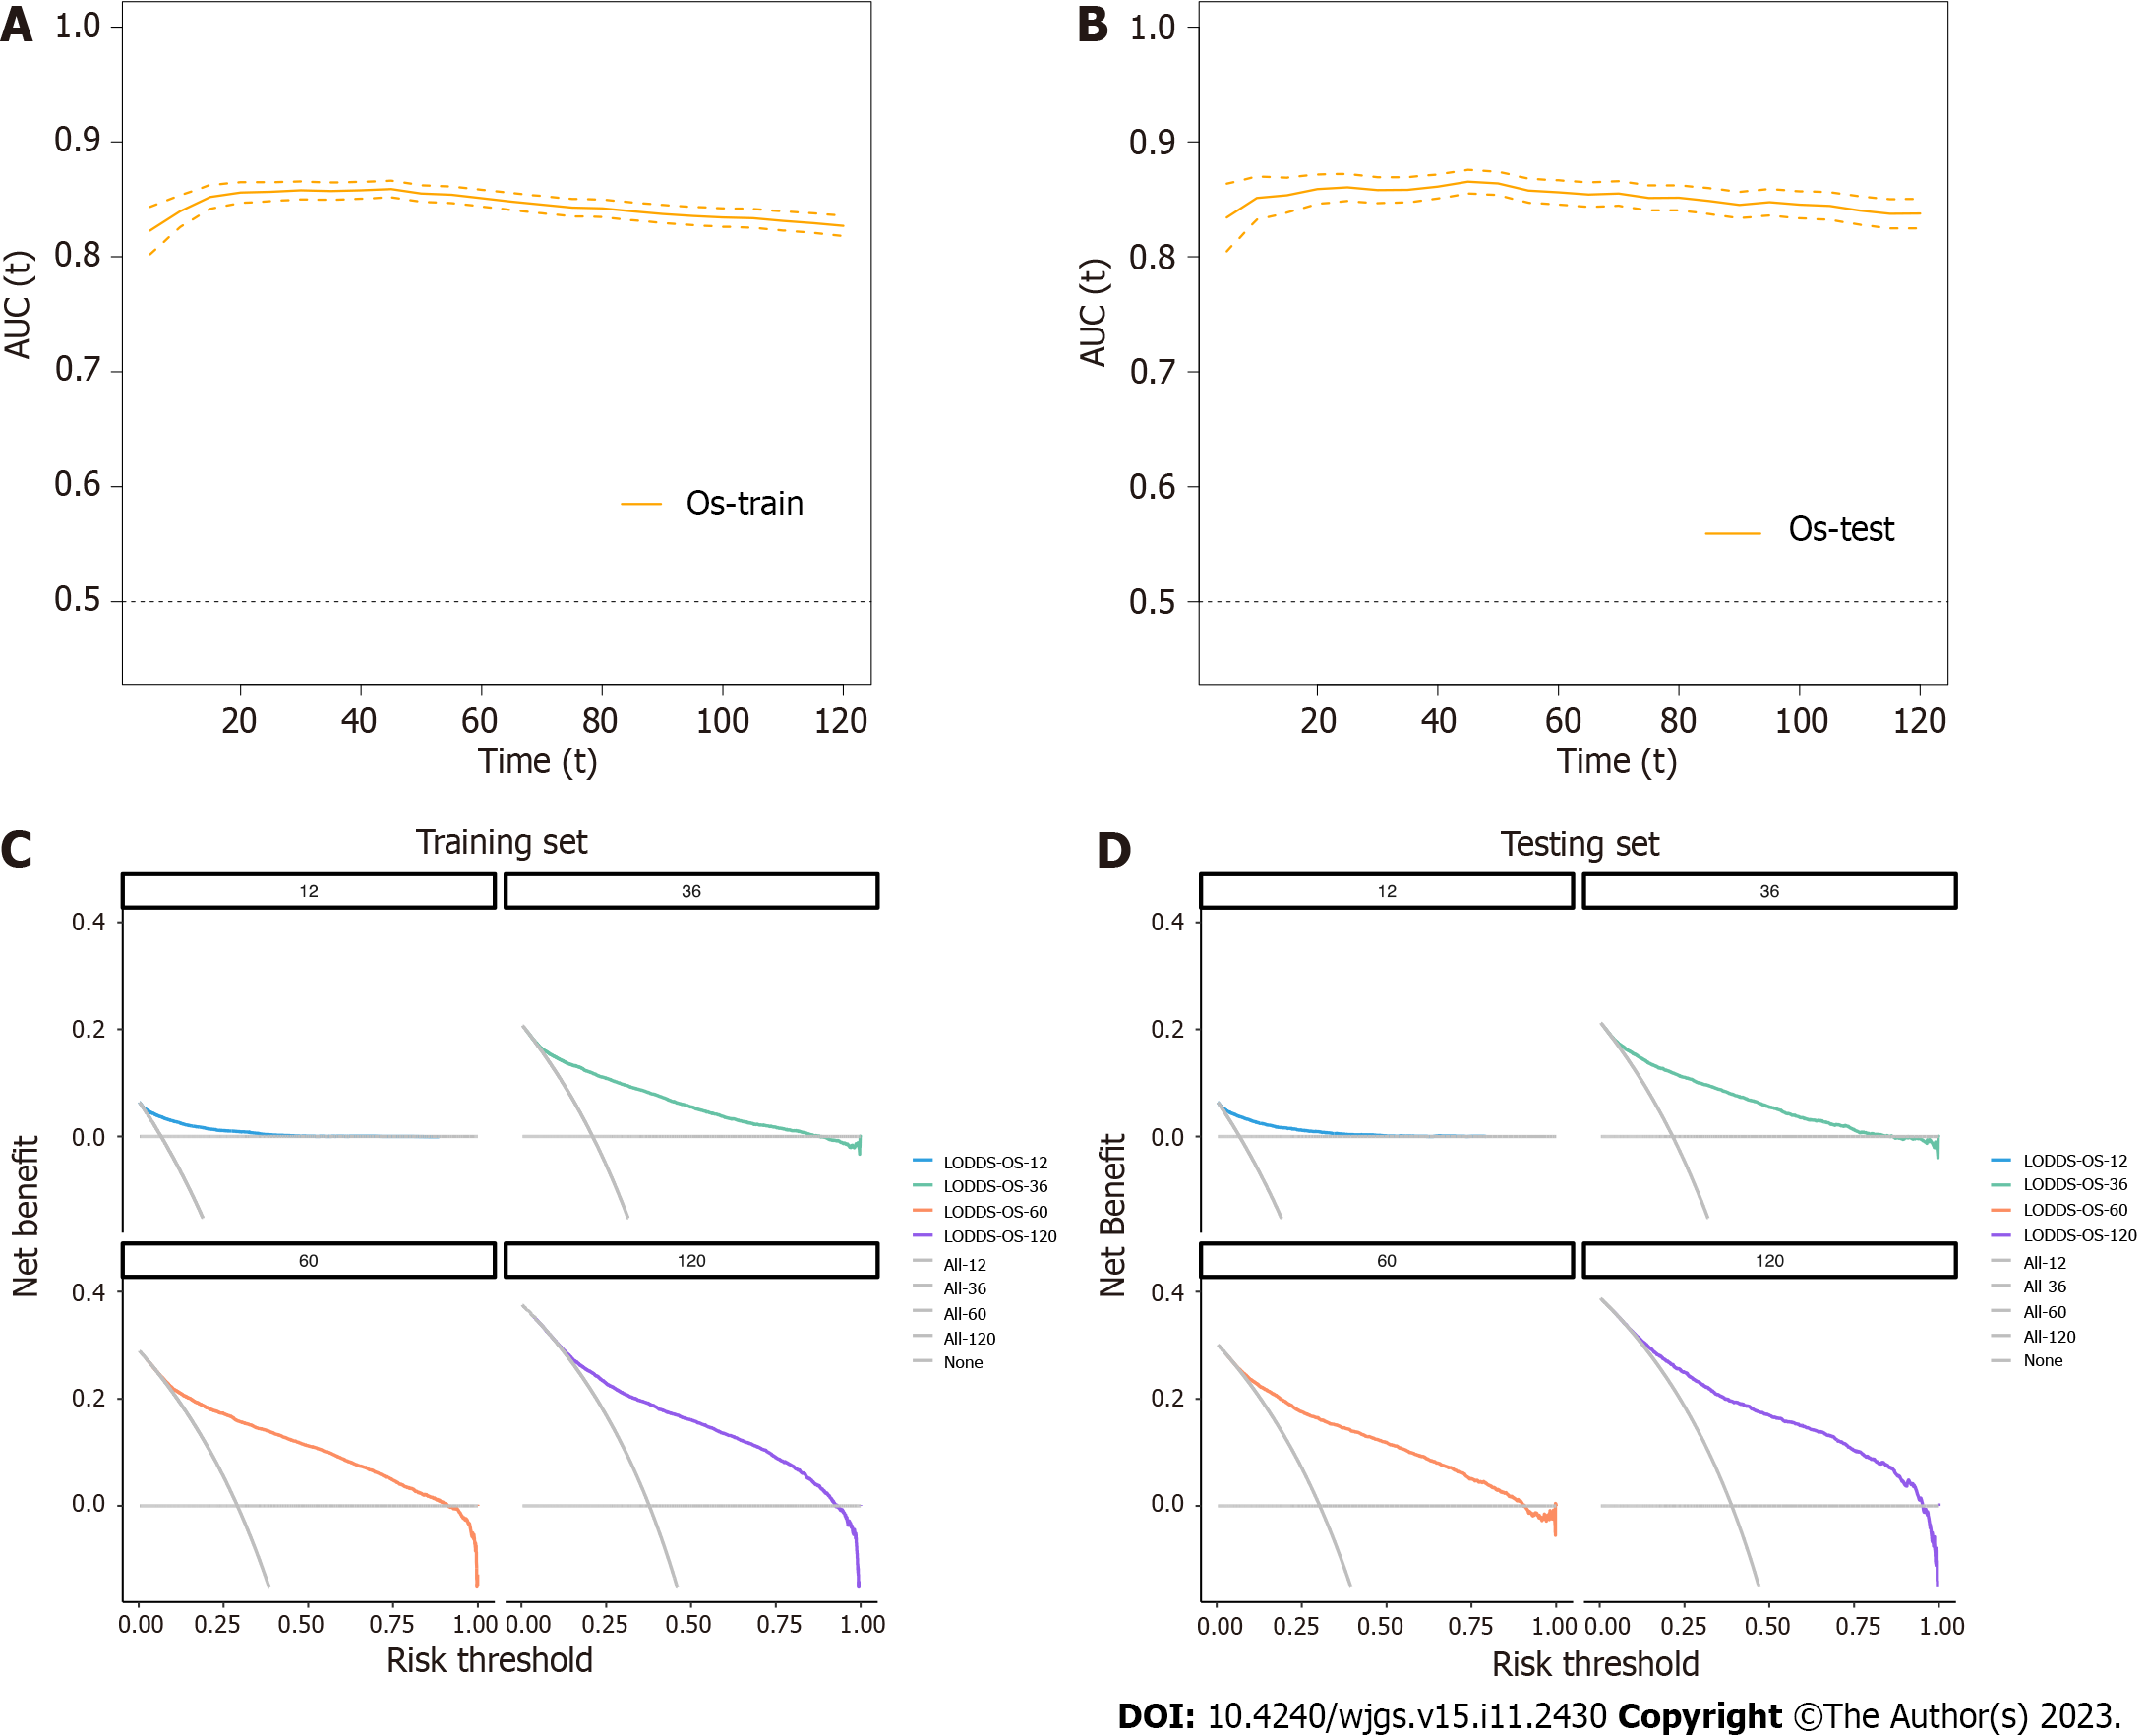
Figure 4 Evaluation of the nomograms for overall survival of early-onset colon cancer patients with area under the curve and decision curve analysis.
A and B: The time-dependent area under the curve for overall survival (OS) in the training (A) and testing (B) cohort; C and D: Decision curves for predicting 1-, 3-, 5- and 10-year OS in training (C) and testing (D) cohort. LODDS: Log odds of positive lymph node; OS: Overall survival; AUC: Area under the curve.
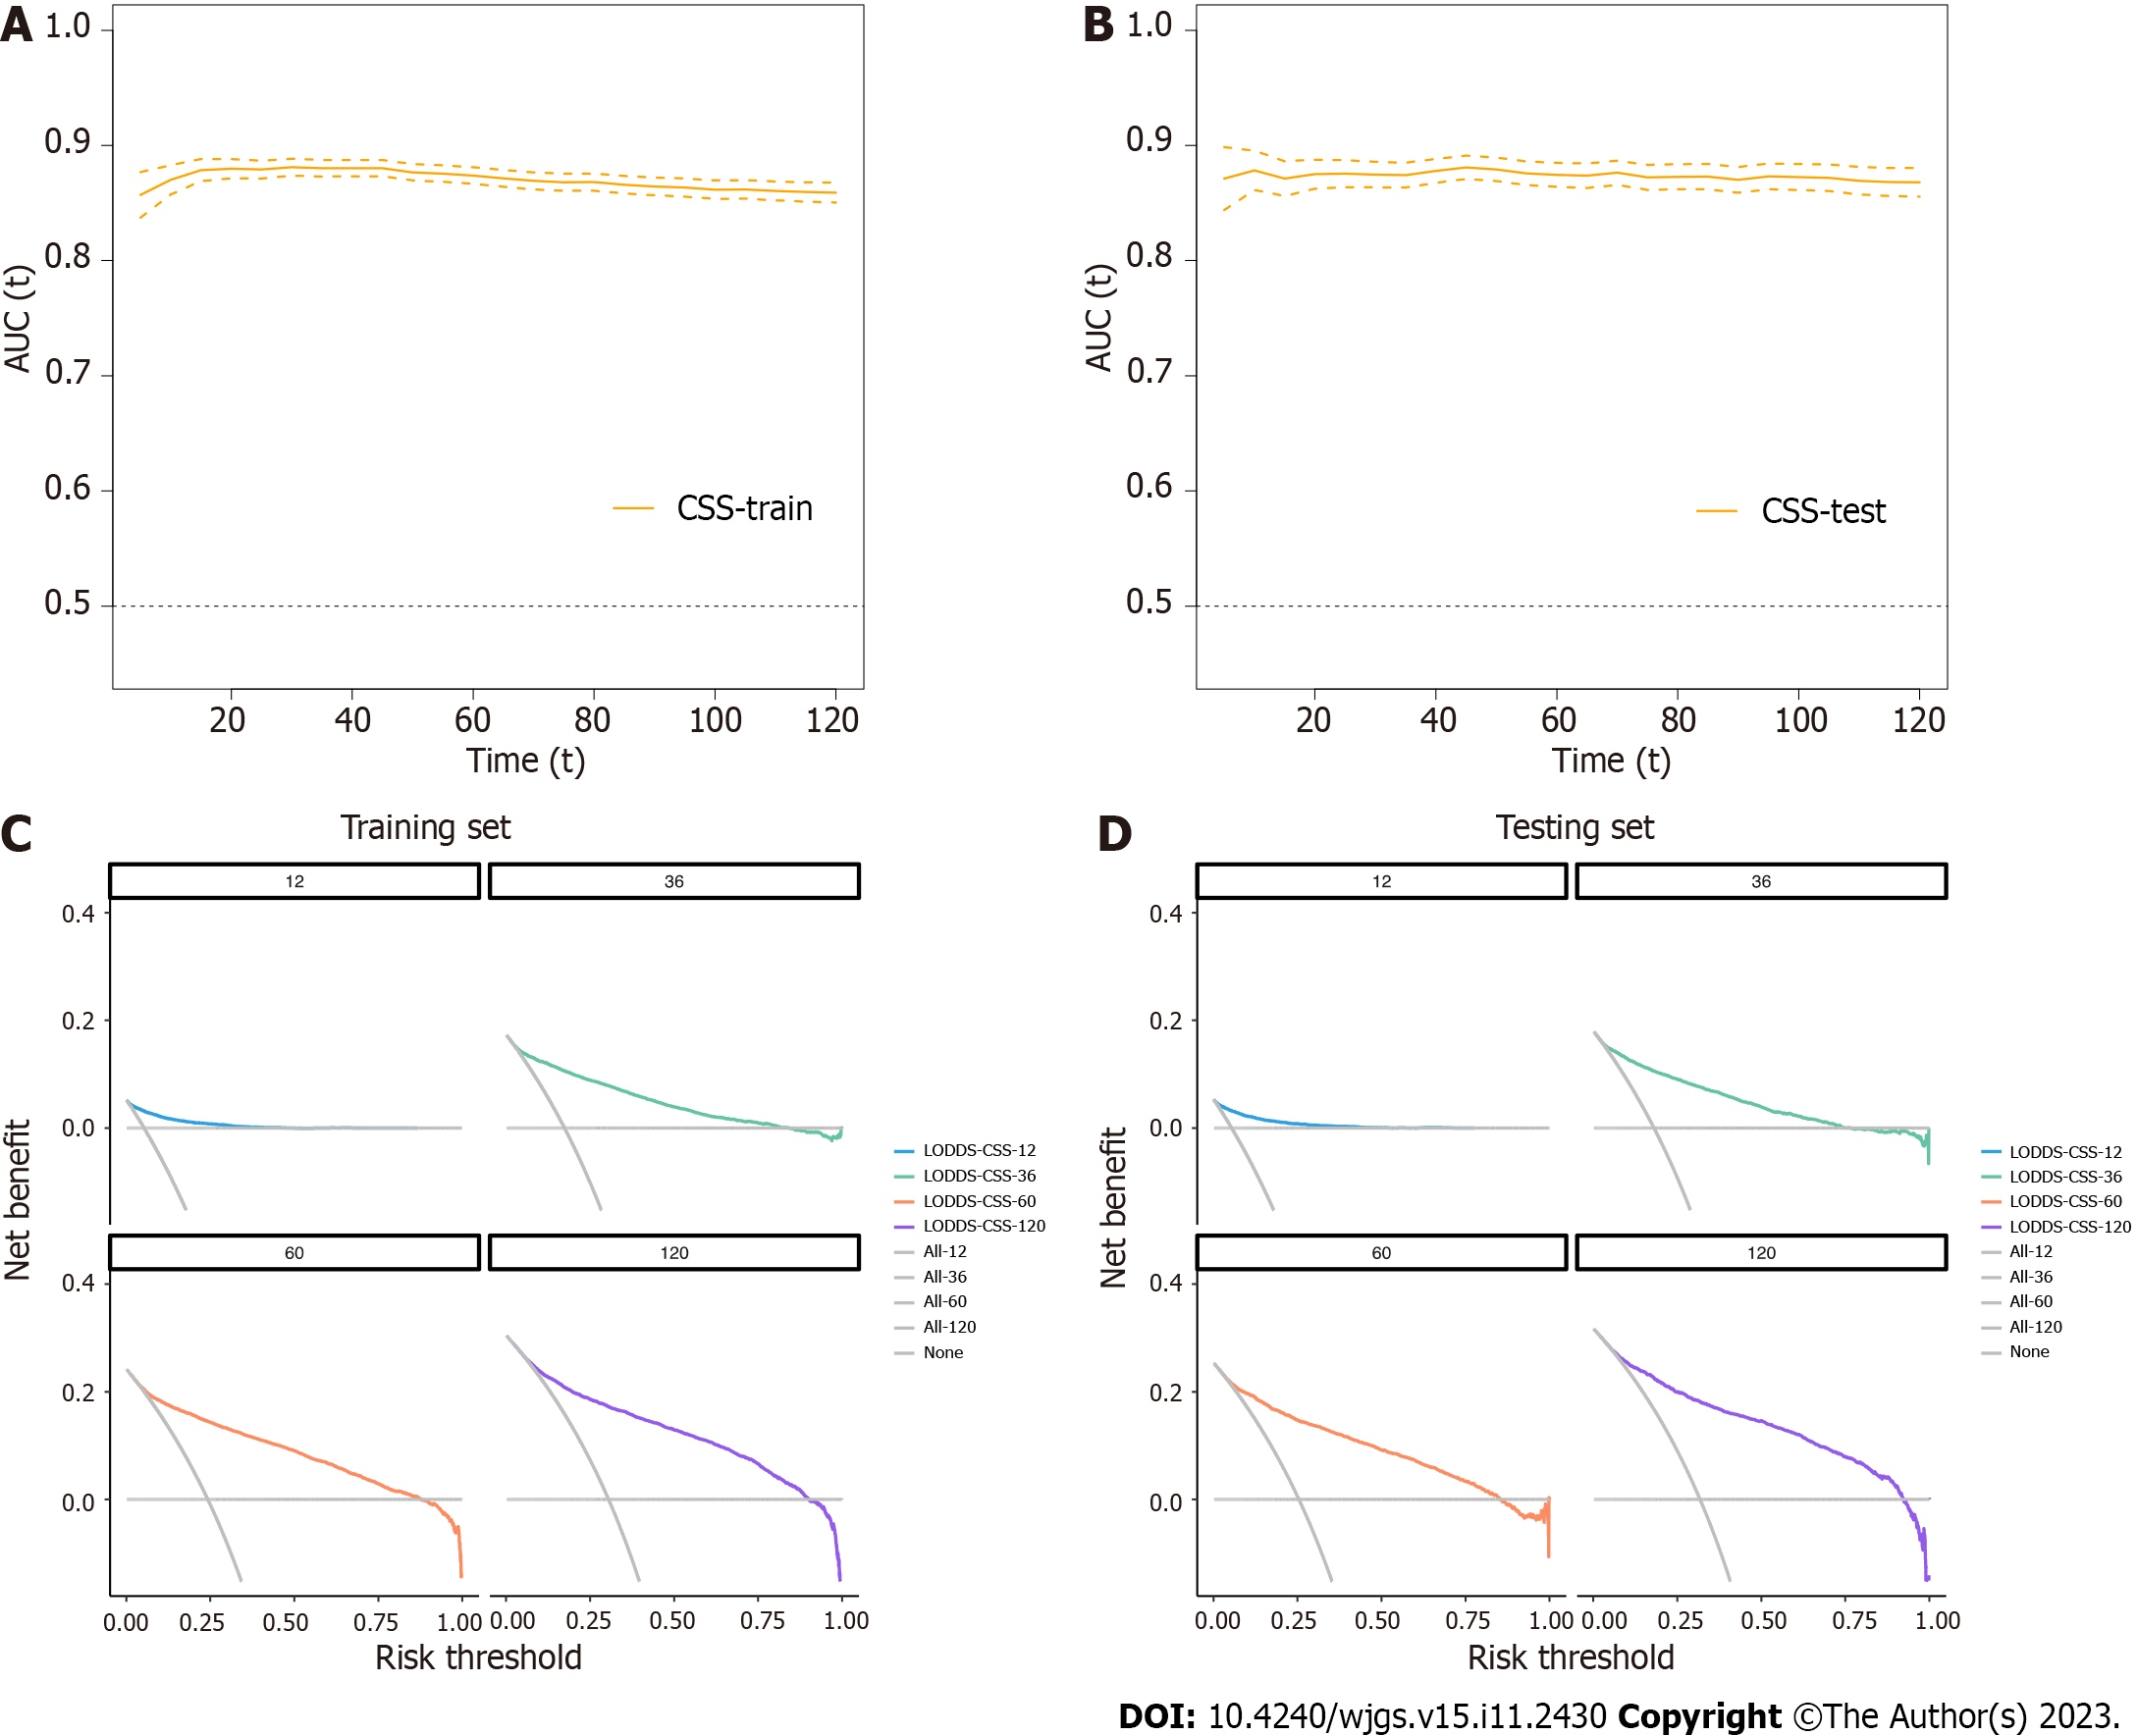
Figure 5 Evaluation of the nomograms for cause-specific survival of early-onset colon cancer patients with area under the curve and decision curve analysis.
A and B: The time-dependent area under the curve for cause-specific survival (CSS) in the train (A) and testing (B) cohort; C and D: Decision curves for predicting 1-, 3-, 5- and 10-year CSS in training (C) and testing (D) cohort. LODDS: Log odds of positive lymph node; CSS: Cause-specific survival; AUC: Area under the curve.
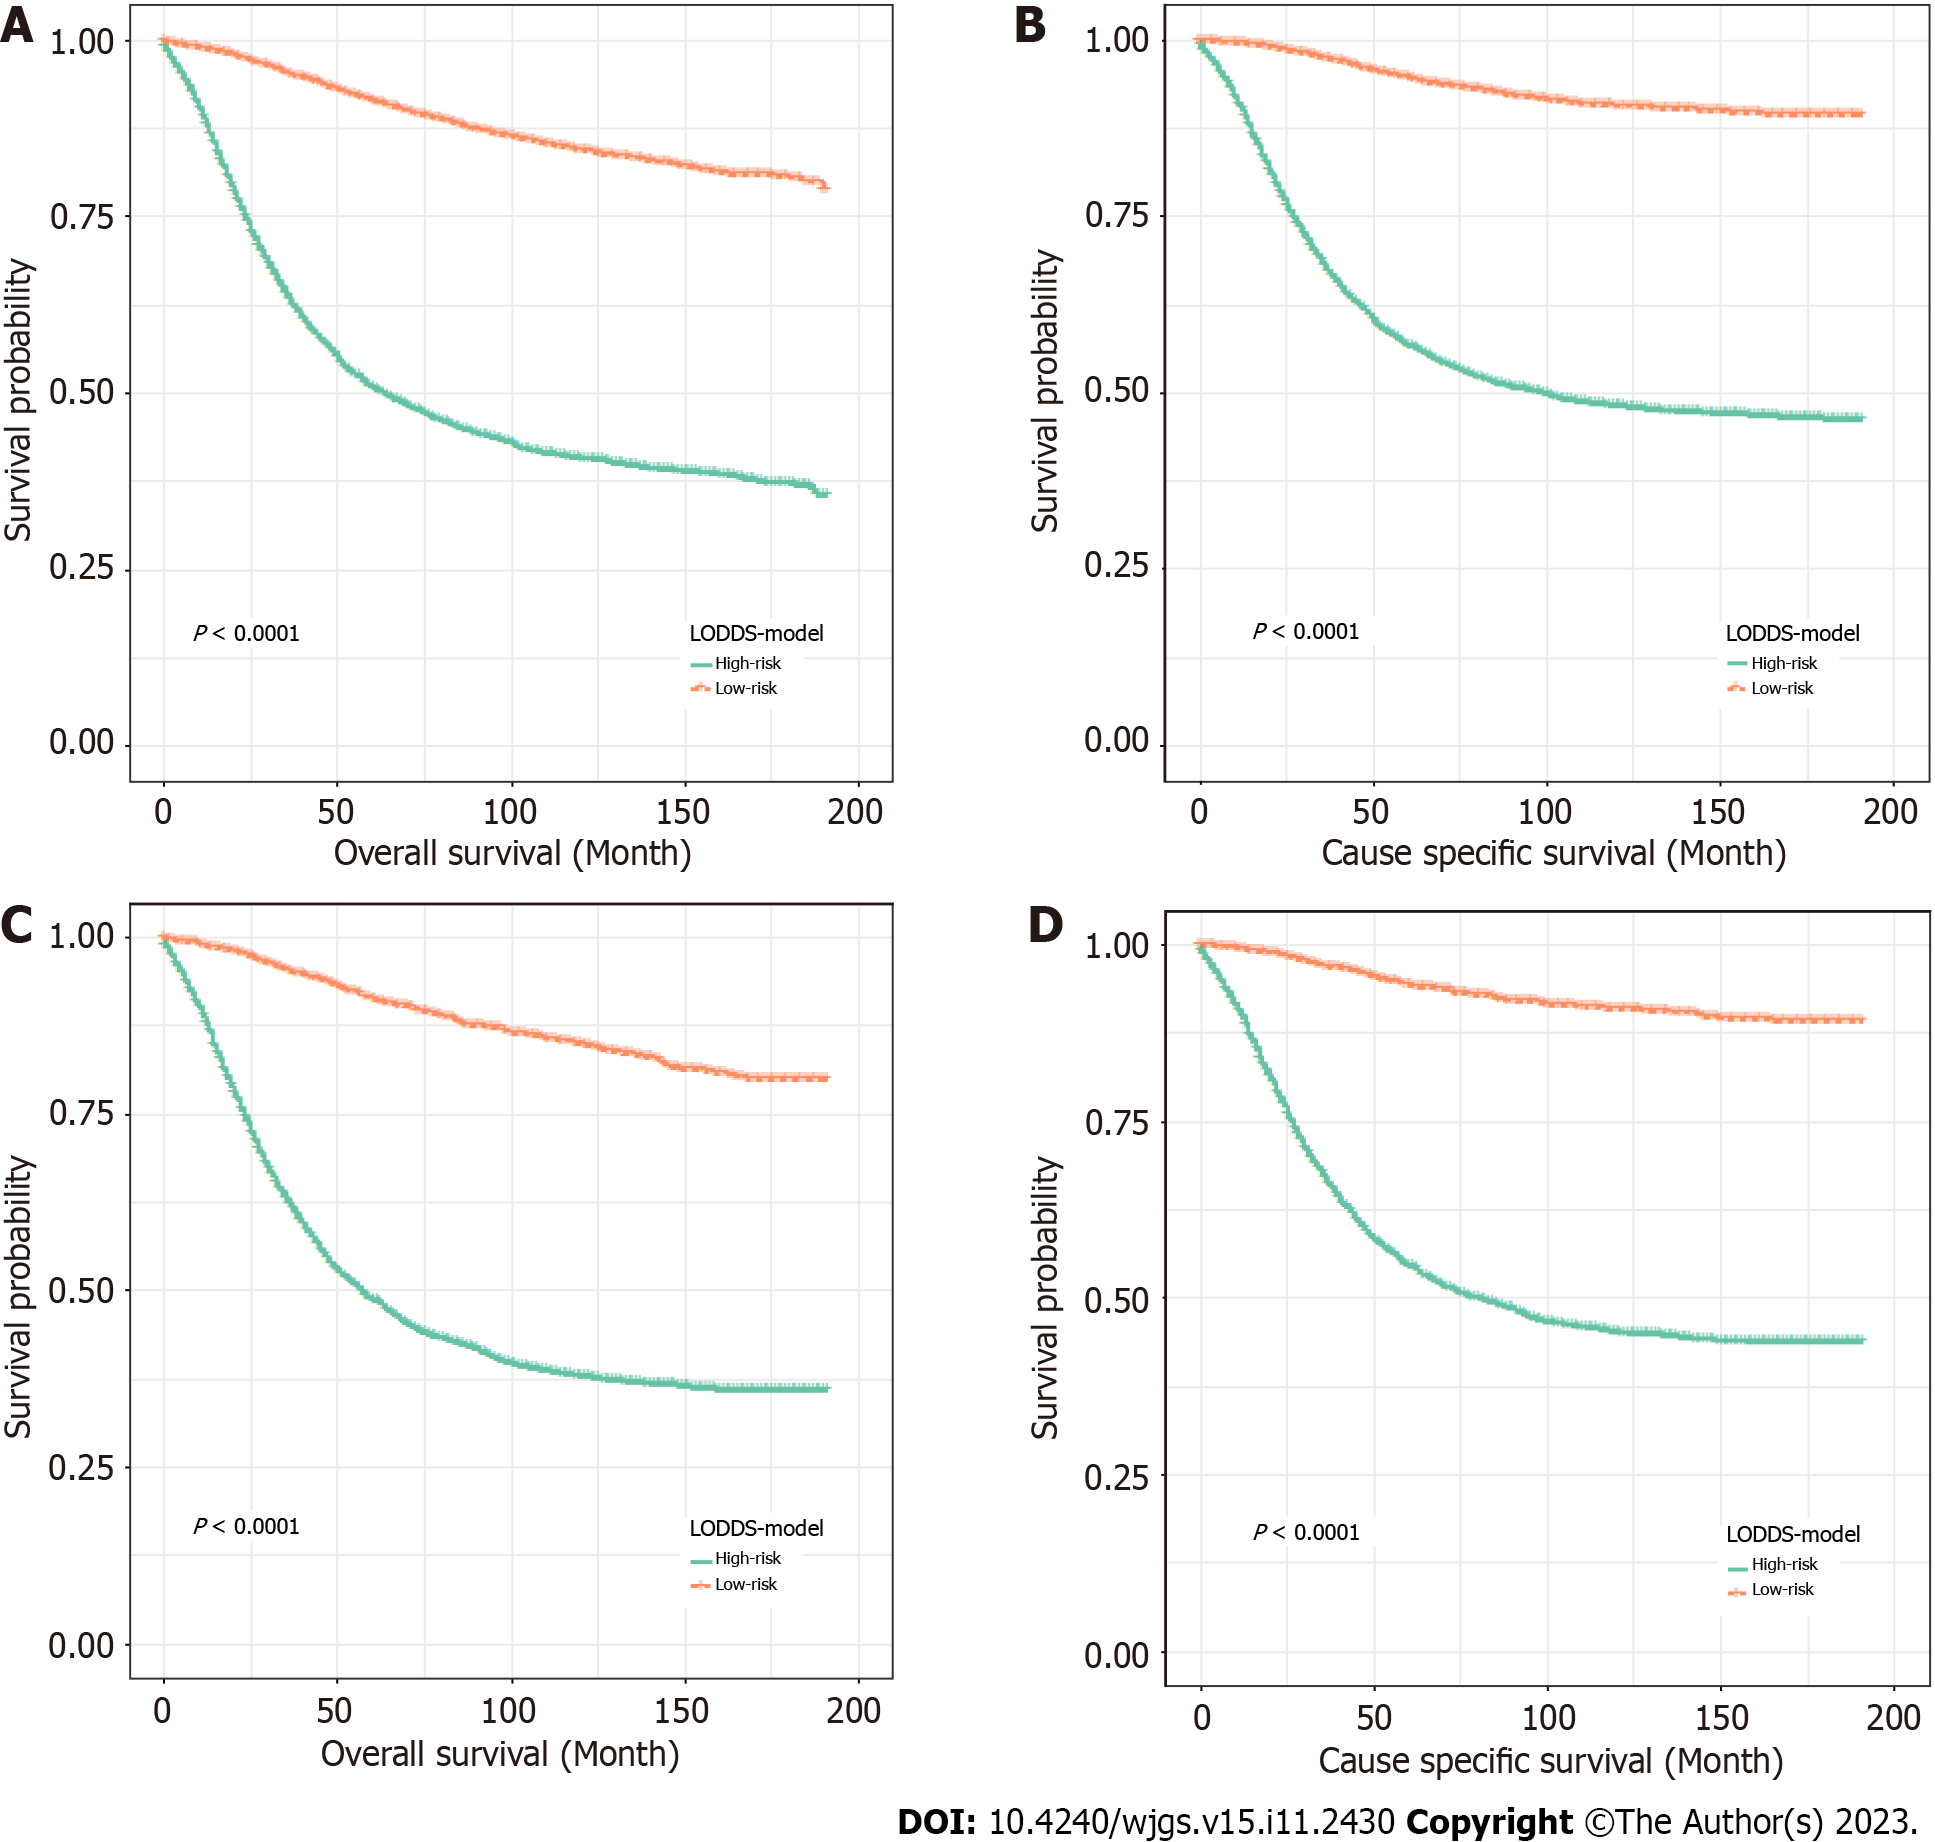
Figure 6 Kaplan-Meier analyses for early-onset colon cancer patients classified by nomograms.
A and B: Kaplan-Meier curves for overall survival (OS) (A) and cause-specific survival (CSS) (B) in the training cohort; C and D: Kaplan-Meier curves for OS (C) and CSS (D) in the testing cohort. LODDS: Log odds of positive lymph node.
- Citation: Xia HB, Chen C, Jia ZX, Li L, Xu AM. Advantage of log odds of positive lymph nodes in prognostic evaluation of patients with early-onset colon cancer. World J Gastrointest Surg 2023; 15(11): 2430-2444
- URL: https://www.wjgnet.com/1948-9366/full/v15/i11/2430.htm
- DOI: https://dx.doi.org/10.4240/wjgs.v15.i11.2430


