Copyright
©The Author(s) 2018.
World J Diabetes. Jun 15, 2018; 9(6): 80-91
Published online Jun 15, 2018. doi: 10.4239/wjd.v9.i6.80
Published online Jun 15, 2018. doi: 10.4239/wjd.v9.i6.80
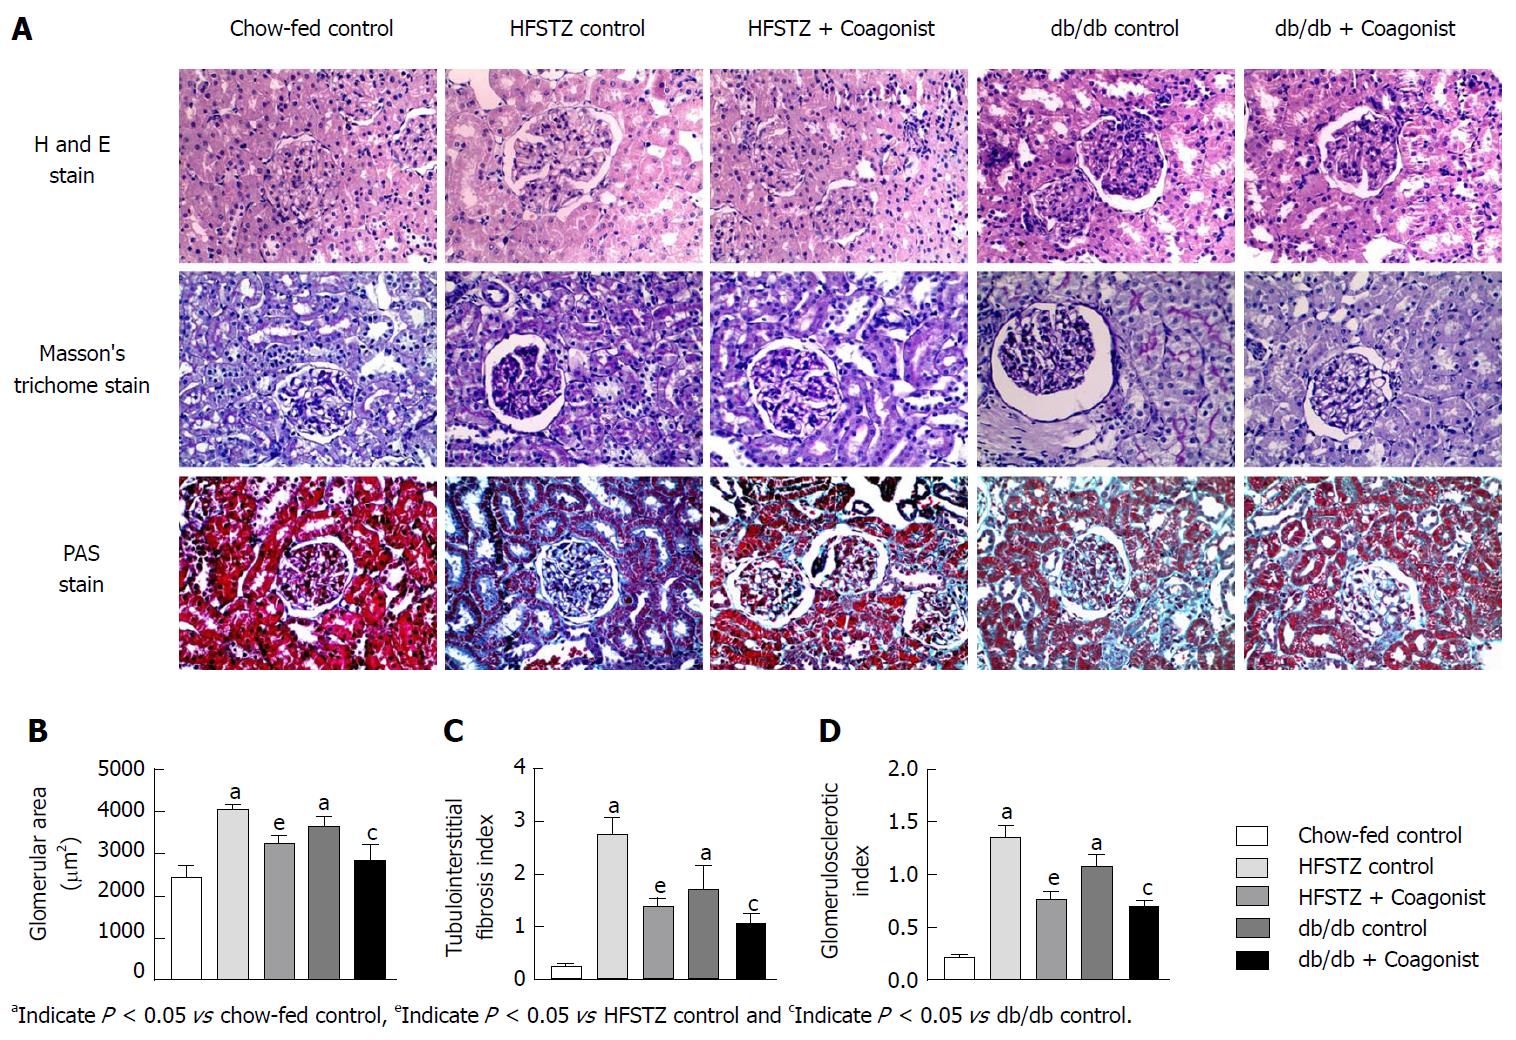
Figure 4 Histology changes in kidney after coagonist treatment in streptozotocin-high-fat and db/db mice.
A: Representative photomicrographs of H and E stain, Masson’s trichome stain, and PAS stain; B: Glomerular surface area; C: Tubulointerstitial fibrosis index; D: Glomerulosclerotic index. All stain magnification: × 400. HFSTZ: Streptozotocin-high-fat; H and E: Haemotoxylin and Eosin; PAS: Periodic acid-Schiff.
- Citation: Patel VJ, Joharapurkar AA, Kshirsagar SG, Sutariya BK, Patel MS, Patel HM, Pandey DK, Bahekar RH, Jain MR. Coagonist of glucagon-like peptide-1 and glucagon receptors ameliorates kidney injury in murine models of obesity and diabetes mellitus. World J Diabetes 2018; 9(6): 80-91
- URL: https://www.wjgnet.com/1948-9358/full/v9/i6/80.htm
- DOI: https://dx.doi.org/10.4239/wjd.v9.i6.80


