Copyright
©The Author(s) 2018.
World J Diabetes. Jun 15, 2018; 9(6): 80-91
Published online Jun 15, 2018. doi: 10.4239/wjd.v9.i6.80
Published online Jun 15, 2018. doi: 10.4239/wjd.v9.i6.80
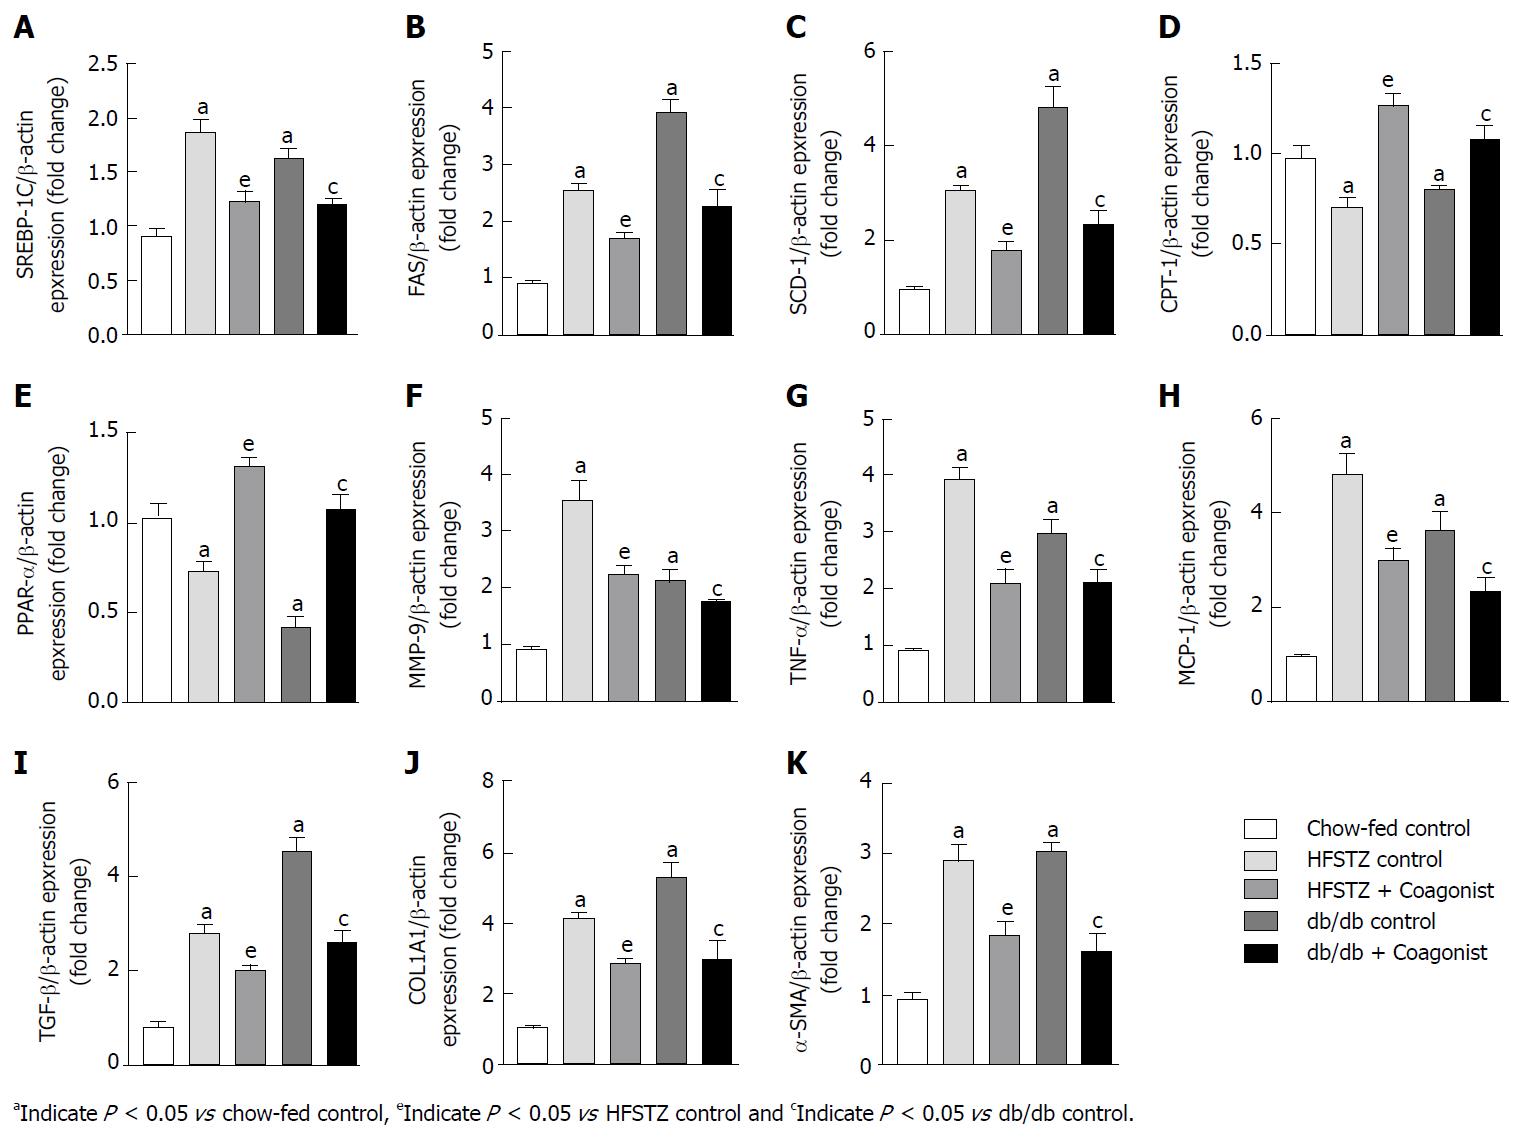
Figure 3 Renal gene expression (relative to β-actin) after coagonist treatment in streptozotocin-high-fat and db/db mice.
A: SREBP-1; B: FAS; C: SCD-1; D: CPT-1; E: PPAR-α; F: MMP-9; G: TNF-α; H: MCP-1; I: TGF-β; J: COL1A1; K: α-SMA. Results are shown as mean ± SE (n = 10) for each group and P < 0.05 considered to be statistically significant. HFSTZ: Streptozotocin-high-fat; SREBP-1: Sterol regulatory element-binding protein 1; FAS: Fatty acid synthase; SCD-1: Stearoyl-CoA desaturase-1; CPT1: Carnitine palmitoyltransferase 1; PPAR-α: Peroxisome proliferator-activated receptor alpha; MPP-9: Matrix metallopeptidase 9; TNF-α: Tumor necrosis factor-alpha; MCP-1: Monocyte chemoattractant protein 1; COL1A1: Collagen type I: alpha 1 chain; α-SMA: Alfa-smooth muscle actin.
- Citation: Patel VJ, Joharapurkar AA, Kshirsagar SG, Sutariya BK, Patel MS, Patel HM, Pandey DK, Bahekar RH, Jain MR. Coagonist of glucagon-like peptide-1 and glucagon receptors ameliorates kidney injury in murine models of obesity and diabetes mellitus. World J Diabetes 2018; 9(6): 80-91
- URL: https://www.wjgnet.com/1948-9358/full/v9/i6/80.htm
- DOI: https://dx.doi.org/10.4239/wjd.v9.i6.80


