Copyright
©The Author(s) 2017.
World J Diabetes. Sep 15, 2017; 8(9): 422-428
Published online Sep 15, 2017. doi: 10.4239/wjd.v8.i9.422
Published online Sep 15, 2017. doi: 10.4239/wjd.v8.i9.422
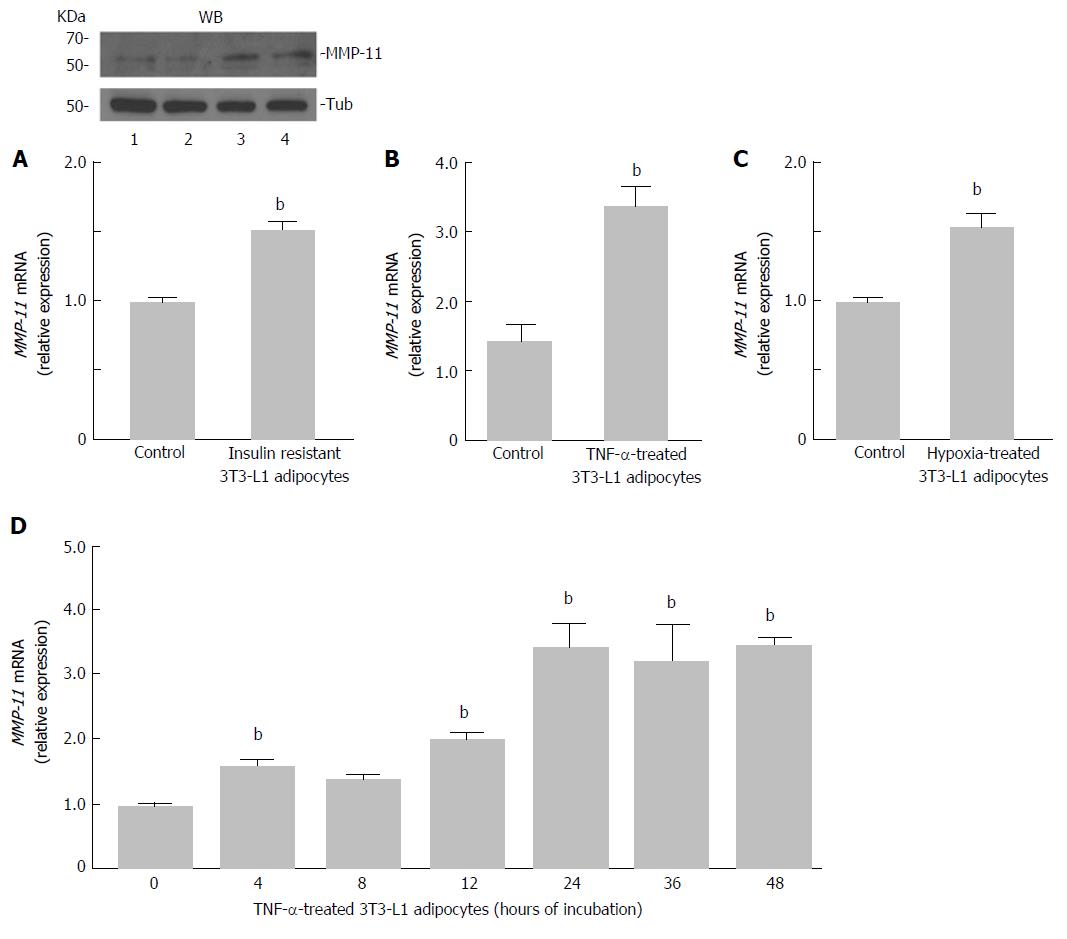
Figure 2 Matrix metalloproteinase-11 expression in insulin-resistant 3T3-L1 adipocytes.
A: Fully differentiated 3T3-L1 adipocytes were co-treated with TNF-α (2.5 nmol/L) and hpoxia (O2 1%) for 24 h, and MMP-11 mRNA was measure by RT-PCR. Results are the means ± SE of three independent experiments, each in triplicate. bP < 0.01 vs untreated (control) cells. A representative western blot (WB) of MMP-11 is shown for each experimental condition. Lanes: 1 and 2, MMP-11 protein expression in untreated 3T3-L1 cells (control); 3 and 4, MMP-11 protein expression in insulin-resistant 3T3-L1 cells. Tubulin (Tub), control of protein loading; B: 3T3-L1 adipocytes were treated with TNF-α alone, at a final concentration of 2.5 nmol/L, and MMP-11 mRNA levels were measured 24 h later by RT-PCR. Results are the means ± SE from three independent experiments. bP < 0.01 vs untreated control cells; C: 3T3-L1 adipocytes were incubated in normoxic (control) or hypoxic condition (O2 1%) for 24 h, total RNA was extracted and the expression of MMP-11 was determined by RT-PCR. Results are the means ± SE from three independent experiments in triplicate. bP < 0.01 vs control; D: Time-course of MMP-11 mRNA expression in differentiated 3T3-L1 adipocytes, in the presence of TNF-α (2.5 nmol/L) alone. MMP-11 mRNA was measured by RT-PCR at the indicated time points, after TNF-α treatment. Results are the means ± SE from three independent experiments, each in triplicate. bP < 0.01 vs time 0. MMP-11: Matrix metalloproteinase-11.
- Citation: Arcidiacono B, Chiefari E, Laria AE, Messineo S, Bilotta FL, Britti D, Foti DP, Foryst-Ludwig A, Kintscher U, Brunetti A. Expression of matrix metalloproteinase-11 is increased under conditions of insulin resistance. World J Diabetes 2017; 8(9): 422-428
- URL: https://www.wjgnet.com/1948-9358/full/v8/i9/422.htm
- DOI: https://dx.doi.org/10.4239/wjd.v8.i9.422


