Copyright
©The Author(s) 2016.
World J Diabetes. Jan 25, 2016; 7(2): 14-26
Published online Jan 25, 2016. doi: 10.4239/wjd.v7.i2.14
Published online Jan 25, 2016. doi: 10.4239/wjd.v7.i2.14
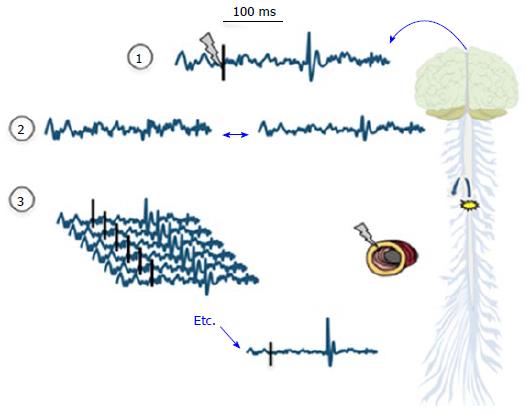
Figure 3 Evoked potentials are recorded following a peripheral stimulus as indicated with the grey “lightning” and ideally a corresponding activity can be seen following 80-90 ms as an evoked potential.
However, as illustrated in (2) the amplitudes of the evoked potential tend to be low and often comparable to the amplitudes of spontaneous electroencephalogram. In order to decode the evoked potentials from the background electroencephalographic activity and noise, signal averaging is necessary as illustrated in (3). Provided enough of recorded trials, the evoked potentials become bigger in amplitude and therefore visible and the random background activity cancel out. Then, the EP latencies and amplitudes of the peaks can be analyzed by visual inspection. When many (64-128) electrodes are used the corresponding brain sources can be computed based on the surface electroencephalographic recordings. EP: Evoked brain potential.
- Citation: Drewes AM, Søfteland E, Dimcevski G, Farmer AD, Brock C, Frøkjær JB, Krogh K, Drewes AM. Brain changes in diabetes mellitus patients with gastrointestinal symptoms. World J Diabetes 2016; 7(2): 14-26
- URL: https://www.wjgnet.com/1948-9358/full/v7/i2/14.htm
- DOI: https://dx.doi.org/10.4239/wjd.v7.i2.14


