Copyright
©The Author(s) 2016.
World J Diabetes. Nov 15, 2016; 7(19): 534-546
Published online Nov 15, 2016. doi: 10.4239/wjd.v7.i19.534
Published online Nov 15, 2016. doi: 10.4239/wjd.v7.i19.534
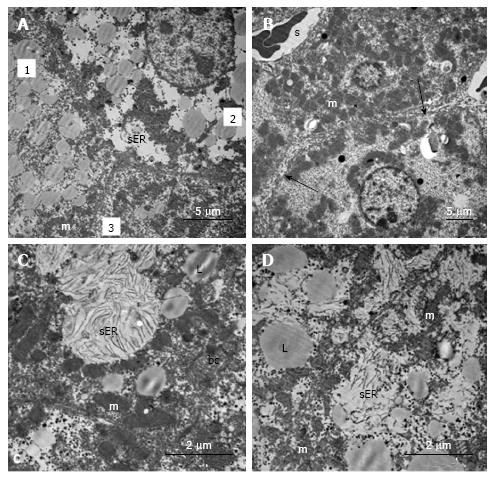
Figure 11 Ultrastructural changes in the hepatocytes of linagliptin-treated db/db mice.
A: Heterogeneity of the hepatocytes: Cells with numerous lipid inclusions (1), cells with areas of hyperplasia of smooth ER and lipid vacuoles (2), cells with a relatively uniform distribution of organelles and rare lipid inclusions (3); B: Cells without hyperplasia of the smooth ER with a relatively homogenous distribution of organelles; distinct microvilli on vascular poles of the hepatocytes and on the lateral sides of parenchymal cells; the extension of spaces between hepatocytes (arrows); C and D: Plots of clusters of smooth ER membranes. L: Lipid inclusion; m: Mitochondria; s: Lumen of the sinusoid; SER: Smooth endoplasmic reticulum; bc: Bile capillary.
- Citation: Michurina SV, Ishenko IJ, Klimontov VV, Archipov SA, Myakina NE, Cherepanova MA, Zavjalov EL, Koncevaya GV, Konenkov VI. Linagliptin alleviates fatty liver disease in diabetic db/db mice. World J Diabetes 2016; 7(19): 534-546
- URL: https://www.wjgnet.com/1948-9358/full/v7/i19/534.htm
- DOI: https://dx.doi.org/10.4239/wjd.v7.i19.534


