Copyright
©The Author(s) 2016.
World J Diabetes. Nov 15, 2016; 7(19): 534-546
Published online Nov 15, 2016. doi: 10.4239/wjd.v7.i19.534
Published online Nov 15, 2016. doi: 10.4239/wjd.v7.i19.534
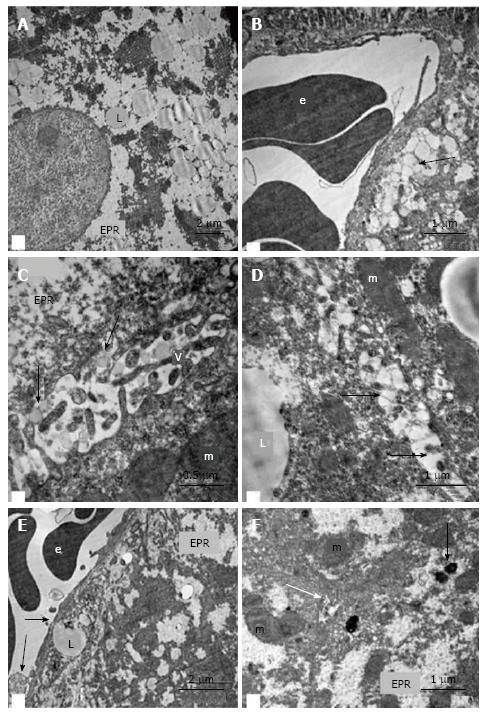
Figure 9 Ultrastructural changes in the hepatocytes of intact db/db mice.
A: Fields of “foamy” hyperplastic smooth ER and fields of glycogen, lipid inclusions in the cytoplasm of hepatocytes; B and E: Pronounced exocytosis of vacuoles with lipid content into the Disse space (arrows); C and D: Pronounced exocytosis of vacuoles with lipid content into gaps between hepatocytes (arrows); F: The bile capillary (white arrow) and compartments of the mito-ER-complexes (complexes from ER and mitochondria), active Golgi complexes, residual bodies and autophagosomes (black arrow) at the biliary poles of hepatocytes. V: Microvilli on the lateral surface of hepatocytes; L: Lipid inclusions; m: Mitochondria; e: Erythrocyte; EPR: Endoplasmic reticulum.
- Citation: Michurina SV, Ishenko IJ, Klimontov VV, Archipov SA, Myakina NE, Cherepanova MA, Zavjalov EL, Koncevaya GV, Konenkov VI. Linagliptin alleviates fatty liver disease in diabetic db/db mice. World J Diabetes 2016; 7(19): 534-546
- URL: https://www.wjgnet.com/1948-9358/full/v7/i19/534.htm
- DOI: https://dx.doi.org/10.4239/wjd.v7.i19.534


