Copyright
©The Author(s) 2016.
World J Diabetes. Nov 15, 2016; 7(19): 523-533
Published online Nov 15, 2016. doi: 10.4239/wjd.v7.i19.523
Published online Nov 15, 2016. doi: 10.4239/wjd.v7.i19.523
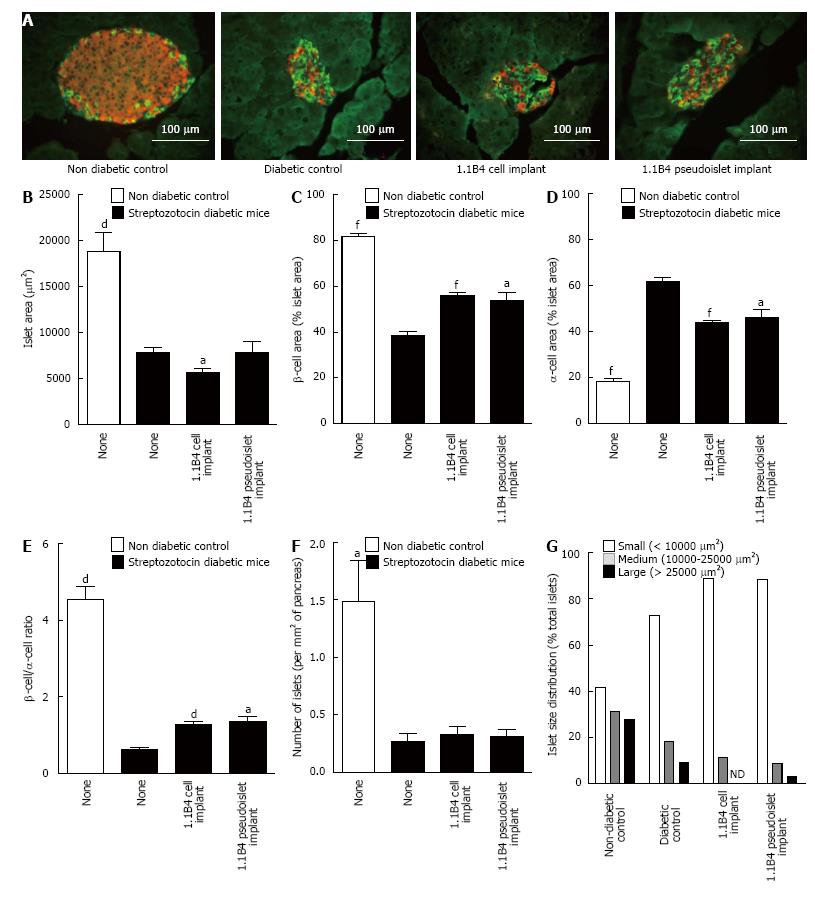
Figure 4 Result of insulin (red) and glucagon (green) staining in islets of non-diabetic and diabetic severe combined immunodeficient mice with or without cell/pseudoislet transplantation.
Representative images are shown in A. Islet area (B), β cell area (C), α cell area (D), β to α cell ratio (E), number of islets (F), and islet size distribution (G) were all determined by quantitative histological analysis using cell^F software. Values are mean ± SEM (n = 5). aP < 0.05, dP < 0.01 and fP < 0.001 vs diabetic control.
- Citation: Green AD, Vasu S, McClenaghan NH, Flatt PR. Implanting 1.1B4 human β-cell pseudoislets improves glycaemic control in diabetic severe combined immune deficient mice. World J Diabetes 2016; 7(19): 523-533
- URL: https://www.wjgnet.com/1948-9358/full/v7/i19/523.htm
- DOI: https://dx.doi.org/10.4239/wjd.v7.i19.523


