Copyright
©The Author(s) 2015.
World J Diabetes. May 15, 2015; 6(4): 662-672
Published online May 15, 2015. doi: 10.4239/wjd.v6.i4.662
Published online May 15, 2015. doi: 10.4239/wjd.v6.i4.662
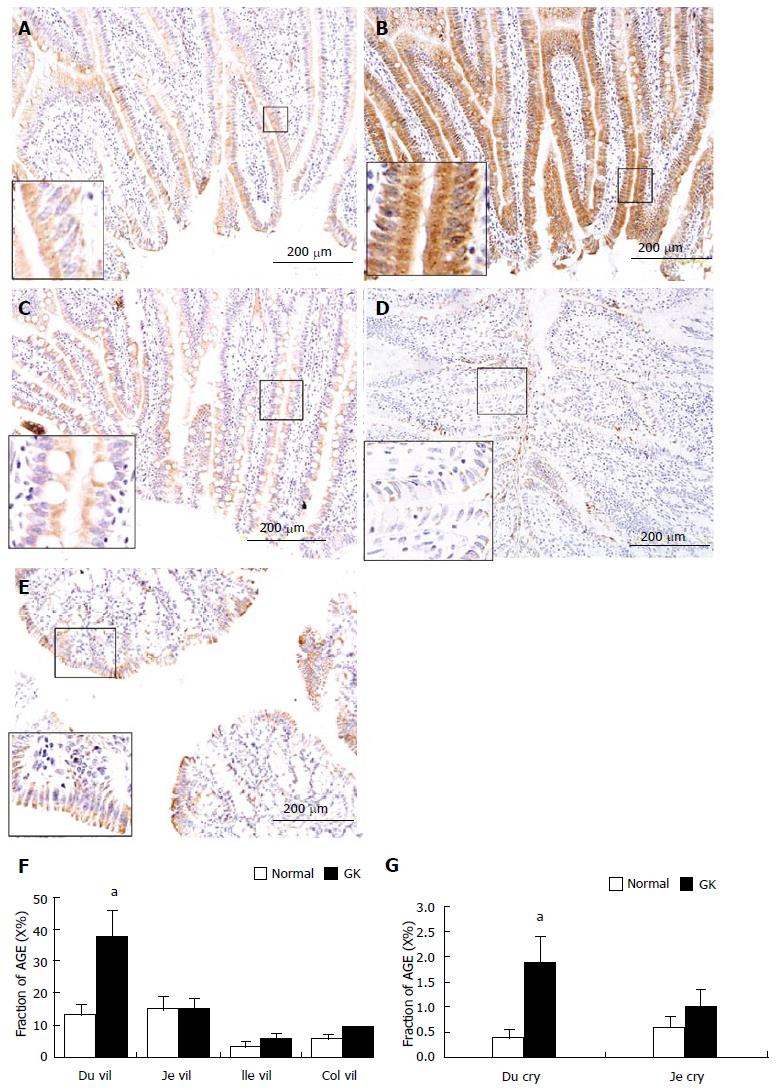
Figure 4 Example of advanced glycation end products immune-staining in villi of duodenum (A, normal; B, diabetic), jejunum (C), ileum (D) and mucosa in colon (E).
The immune-positive area of AGE showed yellow-brown color; 4F and 4G: Show the statistical result of immune-staining intensity in villous epithelial cells of duodenum, jejunum, ileum and colon as well as in crypt epithelial cells of duodenum and jejunum. As shown in the magnification area (big frame vs small frame), the AGE distribution in epithelial cells was inhomogeneous, the surface part was much stronger than bottom part. Values are mean ± SD, n = for each group (compared with normal group: aP < 0.05). Du vil: Duodenum villi; Je vil: Jejunum villi; Ile vil: Ileum villi; Col mu: Colon mucosa; Du cry: Duodenum crypt; GK: Inherited type 2 diabetic Goto-Kakizak rats; AGE: Advanced glycation end products.
- Citation: Chen PM, Gregersen H, Zhao JB. Advanced glycation end-product expression is upregulated in the gastrointestinal tract of type 2 diabetic rats. World J Diabetes 2015; 6(4): 662-672
- URL: https://www.wjgnet.com/1948-9358/full/v6/i4/662.htm
- DOI: https://dx.doi.org/10.4239/wjd.v6.i4.662


