Copyright
©The Author(s) 2015.
World J Diabetes. Apr 15, 2015; 6(3): 517-526
Published online Apr 15, 2015. doi: 10.4239/wjd.v6.i3.517
Published online Apr 15, 2015. doi: 10.4239/wjd.v6.i3.517
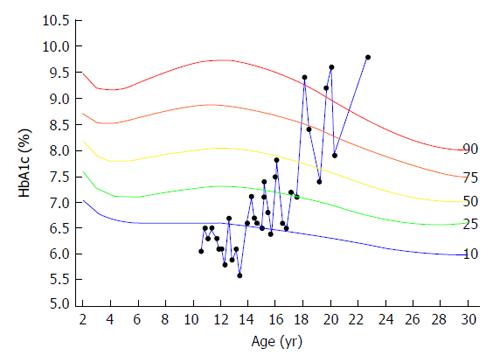
Figure 2 Typical example of the course of HbA1c levels in a patient, with intentional insulin omission for weight loss, plotted on the HbA1c percentile reference curves.
HbA1c levels were around the 10th percentile from age 10 to 14 years. From age 18 the pattern changed and was characterized by sharp increases to levels above the 90th percentile, sharp decreases and multiple measurements above the 90th percentile.
- Citation: Pinhas-Hamiel O, Hamiel U, Levy-Shraga Y. Eating disorders in adolescents with type 1 diabetes: Challenges in diagnosis and treatment. World J Diabetes 2015; 6(3): 517-526
- URL: https://www.wjgnet.com/1948-9358/full/v6/i3/517.htm
- DOI: https://dx.doi.org/10.4239/wjd.v6.i3.517


