Copyright
©The Author(s) 2015.
World J Diabetes. Mar 15, 2015; 6(2): 304-311
Published online Mar 15, 2015. doi: 10.4239/wjd.v6.i2.304
Published online Mar 15, 2015. doi: 10.4239/wjd.v6.i2.304
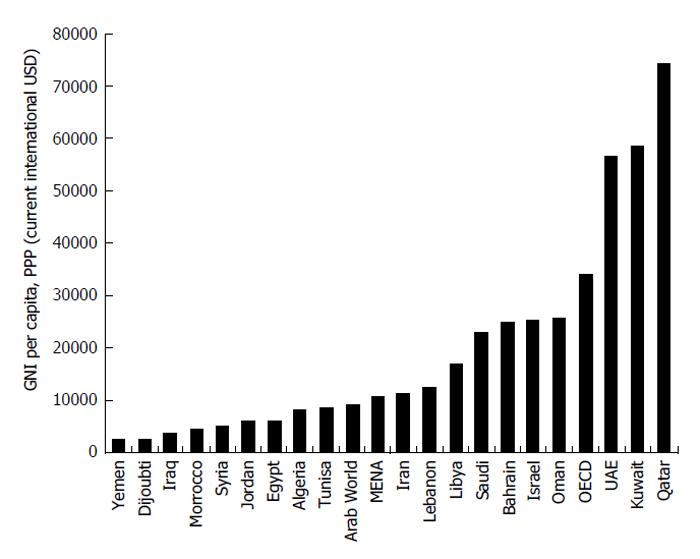
Figure 2 Gross national income per capita based on purchasing power parity of Middle East and North Africa countries.
Egypt falls bellows Arab world average ($5710 vs $8882) where Saudi Arabia is well above average ($22760). OECD: Organization for Economic Co-operation and Development. From World Bank, 2008. UAE: United Arab Emirates; PPP: Purchasing power parity; GNI: Gross national income.
- Citation: Sherif S, Sumpio BE. Economic development and diabetes prevalence in MENA countries: Egypt and Saudi Arabia comparison. World J Diabetes 2015; 6(2): 304-311
- URL: https://www.wjgnet.com/1948-9358/full/v6/i2/304.htm
- DOI: https://dx.doi.org/10.4239/wjd.v6.i2.304


