Copyright
©The Author(s) 2015.
World J Diabetes. Sep 25, 2015; 6(12): 1223-1242
Published online Sep 25, 2015. doi: 10.4239/wjd.v6.i12.1223
Published online Sep 25, 2015. doi: 10.4239/wjd.v6.i12.1223
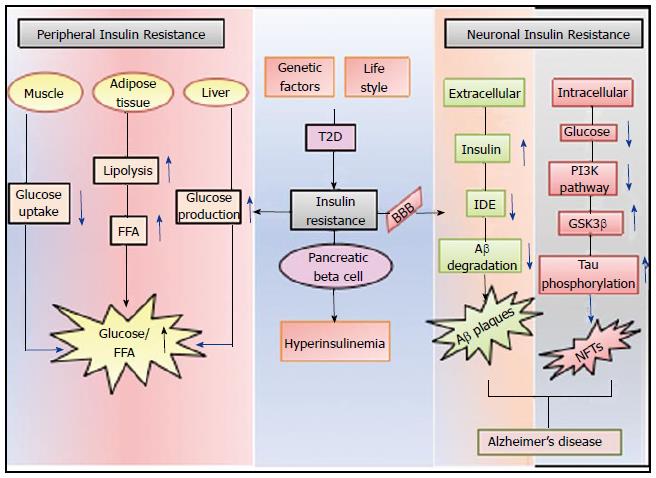
Figure 2 Diagrammatic representation of peripheral and neuronal complications of insulin resistance in case of type 2 diabetes.
Insulin signaling dysfunction in peripheral system affect muscle, adipose tissue and liver (by decreasing glucose uptake, increasing free fatty acids) and by increasing glucose production respectively. When this dysfunction appears in CNS as a diabetes complication (by limited insulin supply to brain), it leads to deposition of Aβ plaques and NFTs in extracellular and intracellular milieu of neurons respectively and represents AD type brain status. AD: Alzheimer’s disease; T2D: Type 2 diabetes; IDE: Insulin degrading enzyme; PI3K: Phosphoinositide 3-kinase; Aβ: Amyloid beta; NFTs: Neurofibrillary tangles; GSK3β: Glycogen synthase kinase 3 beta; FFA: Free fatty acids; BBB: Blood brain barrier.
- Citation: Sandhir R, Gupta S. Molecular and biochemical trajectories from diabetes to Alzheimer’s disease: A critical appraisal. World J Diabetes 2015; 6(12): 1223-1242
- URL: https://www.wjgnet.com/1948-9358/full/v6/i12/1223.htm
- DOI: https://dx.doi.org/10.4239/wjd.v6.i12.1223


