Copyright
©The Author(s) 2015.
World J Diabetes. Feb 15, 2015; 6(1): 184-191
Published online Feb 15, 2015. doi: 10.4239/wjd.v6.i1.184
Published online Feb 15, 2015. doi: 10.4239/wjd.v6.i1.184
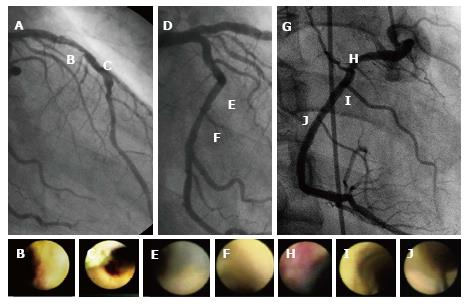
Figure 3 Representative images of prediabetes patients.
A: A 50% stenosis and a 90% stenosis were identified on angiography in the middle part of the left ascending artery; B and C: According to angioscopic findings, both of these lesions were evaluated as grade 3 yellow plaques; D-F: No angiographic stenosis was observed in the left circumflex artery (D), whereas 2 yellow plaques were defined as grades 1 and 2, respectively (E and F); G-J: Significant stenosis was not observed in the right coronary artery (G), whereas an intramural red thrombus was observed at the proximal site (H), and 3 yellow plaques were identified on angioscopy (H–J). The yellow intensity of these plaques was defined as grades 1, 2, and 1, respectively. In this case, the average number of yellow plaques per vessel was 2.33 (7 yellow plaques in 3 vessels), and the maximum yellow grade per coronary artery was 3.
- Citation: Kurihara O, Takano M, Seino Y, Shimizu W, Mizuno K. Coronary atherosclerosis is already ongoing in pre-diabetic status: Insight from intravascular imaging modalities. World J Diabetes 2015; 6(1): 184-191
- URL: https://www.wjgnet.com/1948-9358/full/v6/i1/184.htm
- DOI: https://dx.doi.org/10.4239/wjd.v6.i1.184


