Copyright
©The Author(s) 2015.
World J Diabetes. Feb 15, 2015; 6(1): 175-183
Published online Feb 15, 2015. doi: 10.4239/wjd.v6.i1.175
Published online Feb 15, 2015. doi: 10.4239/wjd.v6.i1.175
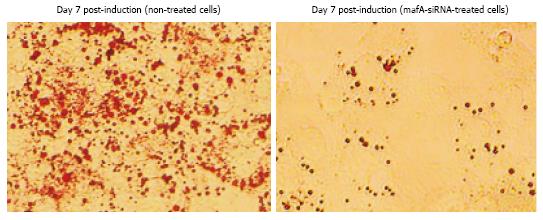
Figure 4 Comparison between histological changes and the Oil-Red-O staining of stop-mafA-siRNA- and mafA-siRNA-treated cells.
Mouse 3T3-L1 pre-adipocytes were induced to differentiate, and Mafa SiRNA was transfected using a transfection reagent. The morphological appearances of the pre-adipocyte culture before induction and 7 d after induction were then compared. The morphology of the 3T3-L1 cells was directly observed, and lipid droplets were stained using Oil Red O. Oil Red O staining was compared between untreated and Mafa-siRNA-treated cells. Intracellular lipid staining was not observed in the Mafa-siRNA-treated cells.
- Citation: Tsuchiya M, Misaka R, Nitta K, Tsuchiya K. Transcriptional factors, Mafs and their biological roles. World J Diabetes 2015; 6(1): 175-183
- URL: https://www.wjgnet.com/1948-9358/full/v6/i1/175.htm
- DOI: https://dx.doi.org/10.4239/wjd.v6.i1.175


