Copyright
©The Author(s) 2015.
World J Diabetes. Feb 15, 2015; 6(1): 17-29
Published online Feb 15, 2015. doi: 10.4239/wjd.v6.i1.17
Published online Feb 15, 2015. doi: 10.4239/wjd.v6.i1.17
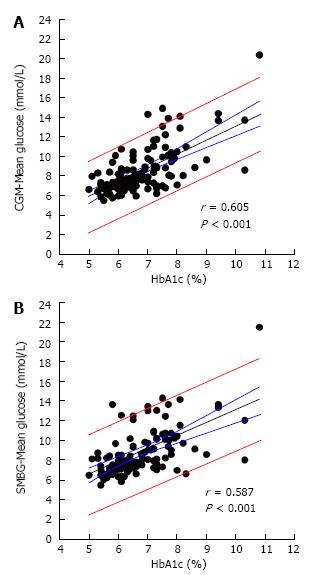
Figure 1 Relationship between hemoglobin A1c and mean glucose obtained from (A) continuous glucose monitoring and (B) self-monitoring of blood glucose in a cohort of 114 non-insulin treated type 2 diabetic patients.
Medians (25th-75th percentile) for age, diabetes duration, and HbA1c were 59.0-68.0 yr, 2.0-10.0 yr, and 6.0%-7.3% (42-56 mmol/mol), respectively. The lines denote the regression lines (black), 95%CI (blue), and prediction intervals (red) (Kohnert et al, Unpublished data). CGM: Continuous glucose monitoring; HbA1c: Hemoglobin A1c.
- Citation: Kohnert KD, Heinke P, Vogt L, Salzsieder E. Utility of different glycemic control metrics for optimizing management of diabetes. World J Diabetes 2015; 6(1): 17-29
- URL: https://www.wjgnet.com/1948-9358/full/v6/i1/17.htm
- DOI: https://dx.doi.org/10.4239/wjd.v6.i1.17


