Copyright
©The Author(s) 2014.
World J Diabetes. Feb 15, 2015; 6(1): 109-124
Published online Feb 15, 2015. doi: 10.4239/wjd.v6.i1.109
Published online Feb 15, 2015. doi: 10.4239/wjd.v6.i1.109
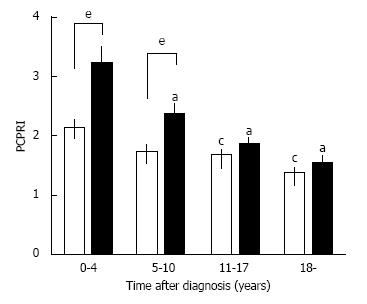
Figure 7 Postprandial C-peptide to glucose ratio (postprandial C-peptide index; PCPRI) in subjects according to obesity and time after diagnosis (0-4, 5-10, 11-17 and ≥ 18 years).
There were significant differences in PCPRI between lean (open bars) and obese subjects (solid bars) in the first and second quartiles of time after diagnosis, but no significant difference was observed in the third and fourth quartiles. aP < 0.05 vs obese subjects ≤ 4 yr after diagnosis, cP < 0.05 vs lean subjects ≤ 4 yr after diagnosis, eP < 0.05 vs lean subjects. Reproduced with permission from ref.[51].
- Citation: Saisho Y. β-cell dysfunction: Its critical role in prevention and management of type 2 diabetes. World J Diabetes 2015; 6(1): 109-124
- URL: https://www.wjgnet.com/1948-9358/full/v6/i1/109.htm
- DOI: https://dx.doi.org/10.4239/wjd.v6.i1.109


