Copyright
©2014 Baishideng Publishing Group Co.
World J Diabetes. Apr 15, 2014; 5(2): 97-114
Published online Apr 15, 2014. doi: 10.4239/wjd.v5.i2.97
Published online Apr 15, 2014. doi: 10.4239/wjd.v5.i2.97
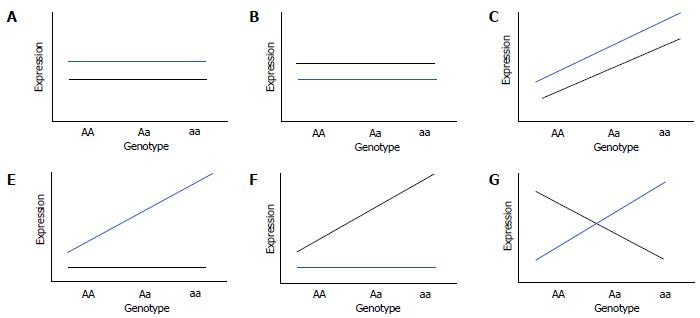
Figure 5 Types of gene-by-environment interactions in cellular genomic models to study gene-by-environment expression quantitative trait locis.
Cells from a cohort of subjects are grown in pairs under uniform in vitro treated and untreated conditions to study environment-dependent or -independent effects of genotype on expression of transcripts (a quantitative trait). β1 and β2 are genotype effects on transcript expression under treated and control conditions, respectively. Different models of gene-by-environment (GXE) includes Null model: β1 = β2 = 0 (A and B); No-interaction eQTL model: β1 = β2 ≠ 0 (C); Treated-only expression quantitative trait loci model: β1 ≠ 0 and β2 = 0 (D); Control-only eQTL model: β1 = 0 and β2 ≠ 0 (E); and General interaction eQTL model: β1 ≠ 0 and β2 ≠ 0 but β1 ≠β2 (F). Black line indicates expression in cells under control condition (untreated) while blue line indicates expression in environmental/dietary factor treated cells.
- Citation: Das SK, Sharma NK. Expression quantitative trait analyses to identify causal genetic variants for type 2 diabetes susceptibility. World J Diabetes 2014; 5(2): 97-114
- URL: https://www.wjgnet.com/1948-9358/full/v5/i2/97.htm
- DOI: https://dx.doi.org/10.4239/wjd.v5.i2.97


