Copyright
©2014 Baishideng Publishing Group Co.
World J Diabetes. Apr 15, 2014; 5(2): 97-114
Published online Apr 15, 2014. doi: 10.4239/wjd.v5.i2.97
Published online Apr 15, 2014. doi: 10.4239/wjd.v5.i2.97
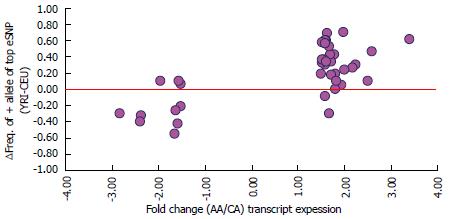
Figure 4 Population differences in expression of transcripts in adipose tissue is accounted for by the effect allele frequency difference of expression regulatory SNPs among racial groups.
X axis: Fold change in average expression of 41 transcripts between African-American (AA, n = 37) and Caucasian (CA, n = 99) subjects. Y axis: Differences in strongest eSNP allele frequency of these transcripts between HapMap subjects of Caucasian (CEU) and African (YRI) ancestry for alleles associated with higher expression. eSNP: Expression regulatory SNP.
- Citation: Das SK, Sharma NK. Expression quantitative trait analyses to identify causal genetic variants for type 2 diabetes susceptibility. World J Diabetes 2014; 5(2): 97-114
- URL: https://www.wjgnet.com/1948-9358/full/v5/i2/97.htm
- DOI: https://dx.doi.org/10.4239/wjd.v5.i2.97


