Copyright
©2013 Baishideng Publishing Group Co.
World J Diabetes. Aug 15, 2013; 4(4): 145-150
Published online Aug 15, 2013. doi: 10.4239/wjd.v4.i4.145
Published online Aug 15, 2013. doi: 10.4239/wjd.v4.i4.145
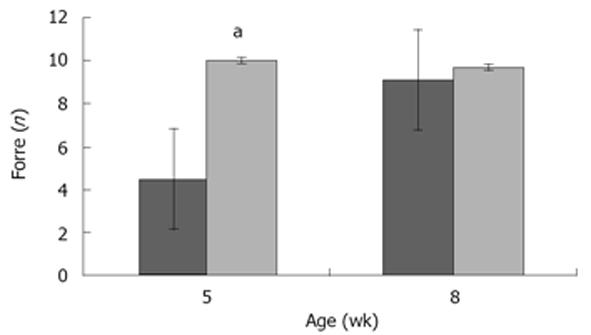
Figure 3 Tibia strength by 3-point breakage analysis using the NTS 85MTS Minibionix8 with a 100 N load cell.
The span was 9 mm and the bones were loaded with a rate of 0.1 mm/s to evaluate maximum load to failure in 5 and 8 wk in non-obese diabetic (dark gray bars) and syngenic non-diabetic (light gray bars). Error bars represent SEM. aNon-obese diabetic mice demonstrated less mechanical strength than syngenic non-diabetic mice at 5 wk.
- Citation: Casazza K, Hanks LJ, Clines GA, Tse HM, Eberhardt AW. Diabetes-related impairment in bone strength is established early in the life course. World J Diabetes 2013; 4(4): 145-150
- URL: https://www.wjgnet.com/1948-9358/full/v4/i4/145.htm
- DOI: https://dx.doi.org/10.4239/wjd.v4.i4.145


