Copyright
©2012 Baishideng Publishing Group Co.
World J Diabetes. May 15, 2012; 3(5): 80-93
Published online May 15, 2012. doi: 10.4239/wjd.v3.i5.80
Published online May 15, 2012. doi: 10.4239/wjd.v3.i5.80
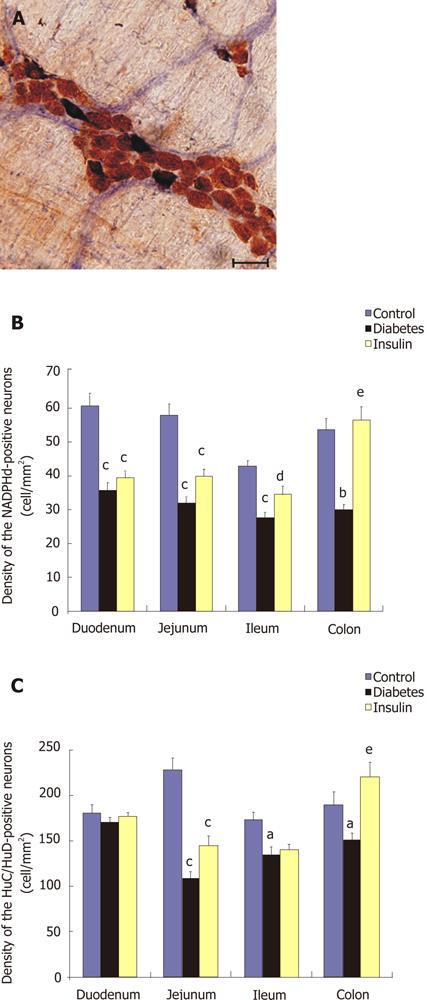
Figure 2 Diabetes-related quantitative changes in the density of total and nitrergic myenteric neurons.
Representative micrograph of whole-mount preparation of the myenteric plexus of the duodenum from control rat double-labeled with HuC/HuD and nicotinamide adenine dinucleotide phosphate-diaphorase (A). All nitrergic neurons were double-labeled for the two markers. The calibration bar denotes 50 μm. Densities of HuC/HuD-immunoreactive myenteric neurons (B) and nicotinamide adenine dinucleotide phosphate-diaphorase-positive myenteric neurons (C) in the duodenum, jejunum, ileum and colon of control, diabetic and insulin-treated diabetic rats. Data are expressed as mean ± SE. aP < 0.05, bP < 0.01, cP < 0.001 vs the control group; dP < 0.05, eP < 0.001 vs untreated diabetic group. NADPH: Nicotinamide adenine dinucleotide phosphate.
- Citation: Bagyánszki M, Bódi N. Diabetes-related alterations in the enteric nervous system and its microenvironment. World J Diabetes 2012; 3(5): 80-93
- URL: https://www.wjgnet.com/1948-9358/full/v3/i5/80.htm
- DOI: https://dx.doi.org/10.4239/wjd.v3.i5.80


