Copyright
©The Author(s) 2025.
World J Diabetes. May 15, 2025; 16(5): 99473
Published online May 15, 2025. doi: 10.4239/wjd.v16.i5.99473
Published online May 15, 2025. doi: 10.4239/wjd.v16.i5.99473
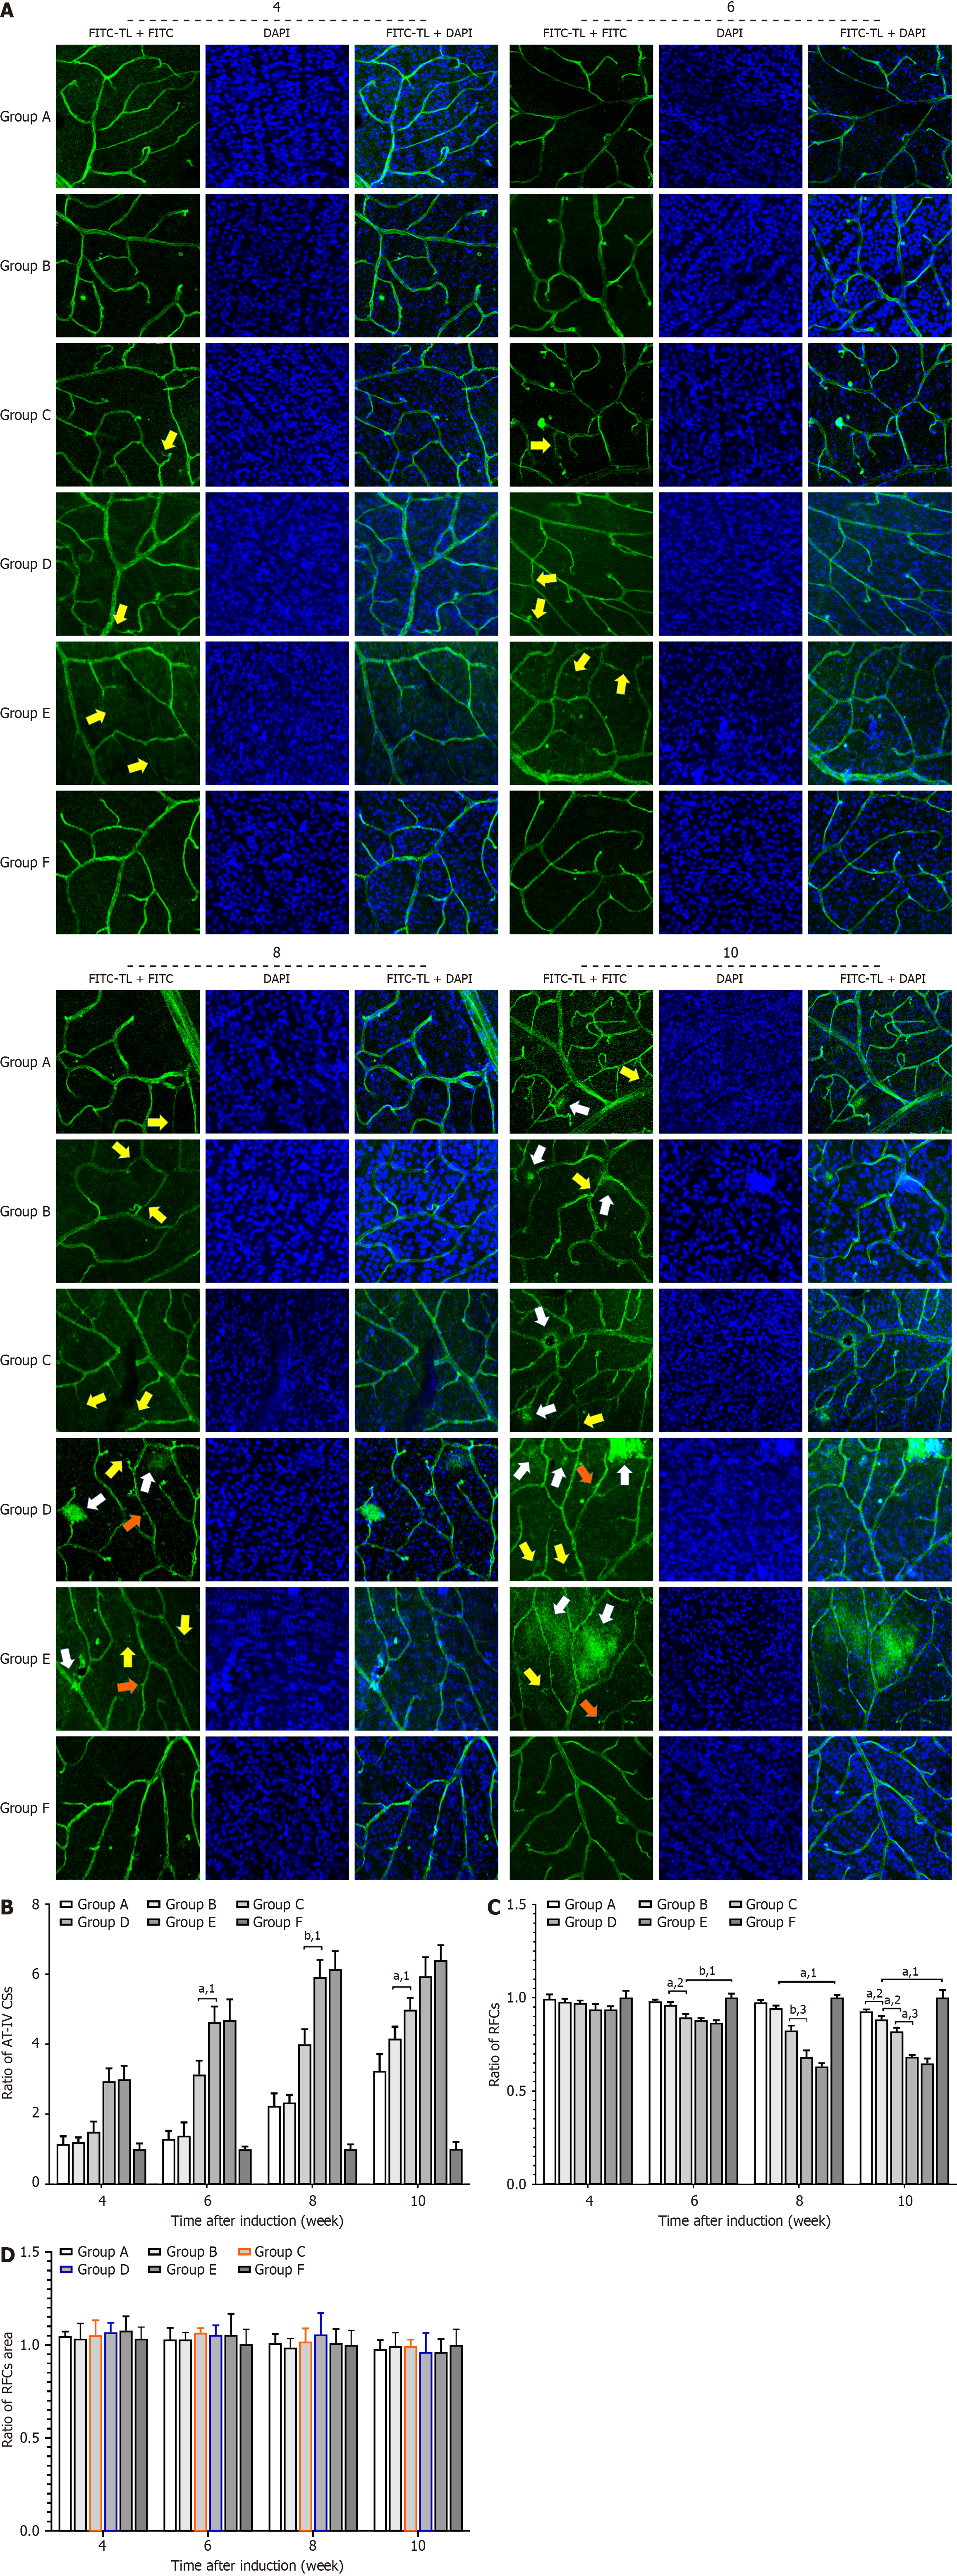
Figure 8 Immunohistochemical imaging and the ratio of the number of type IV collagen-positive strands, retinal cells, and area of retinal cells.
A: Immunohistochemical imaging of retinal tissues in Sprague-Dawley rats (magnification: 100 ×). B-D: Ratio of the number of type IV collagen-positive strands, retinal cells, and area of retinal cells during the sixth, eighth, and tenth weeks, respectively. The white arrows indicate type IV collagen-positive strands. The yellow arrows indicate areas of vascular permeability. The orange arrows indicate vascular buds. All results are expressed as the mean ± SD. aP < 0.05. bP < 0.01. 1P vs F group. 2P vs B group. 3P vs D group. AT-IV: Anti-IV; CSs: Collagen strands; DAPI: 4’,6-diamidino-2-phenylindole; FITC: Fluorescein isothiocyanate; TL: Tomato lectin; RFC: Retinal cell.
- Citation: Lin YT, Tan J, Tao YL, Hu WW, Wang YC, Huang J, Zhou Q, Xiao A. Effect of ranibizumab on diabetic retinopathy via the vascular endothelial growth factor/STAT3/glial fibrillary acidic protein pathway. World J Diabetes 2025; 16(5): 99473
- URL: https://www.wjgnet.com/1948-9358/full/v16/i5/99473.htm
- DOI: https://dx.doi.org/10.4239/wjd.v16.i5.99473


