Copyright
©The Author(s) 2025.
World J Diabetes. May 15, 2025; 16(5): 99473
Published online May 15, 2025. doi: 10.4239/wjd.v16.i5.99473
Published online May 15, 2025. doi: 10.4239/wjd.v16.i5.99473
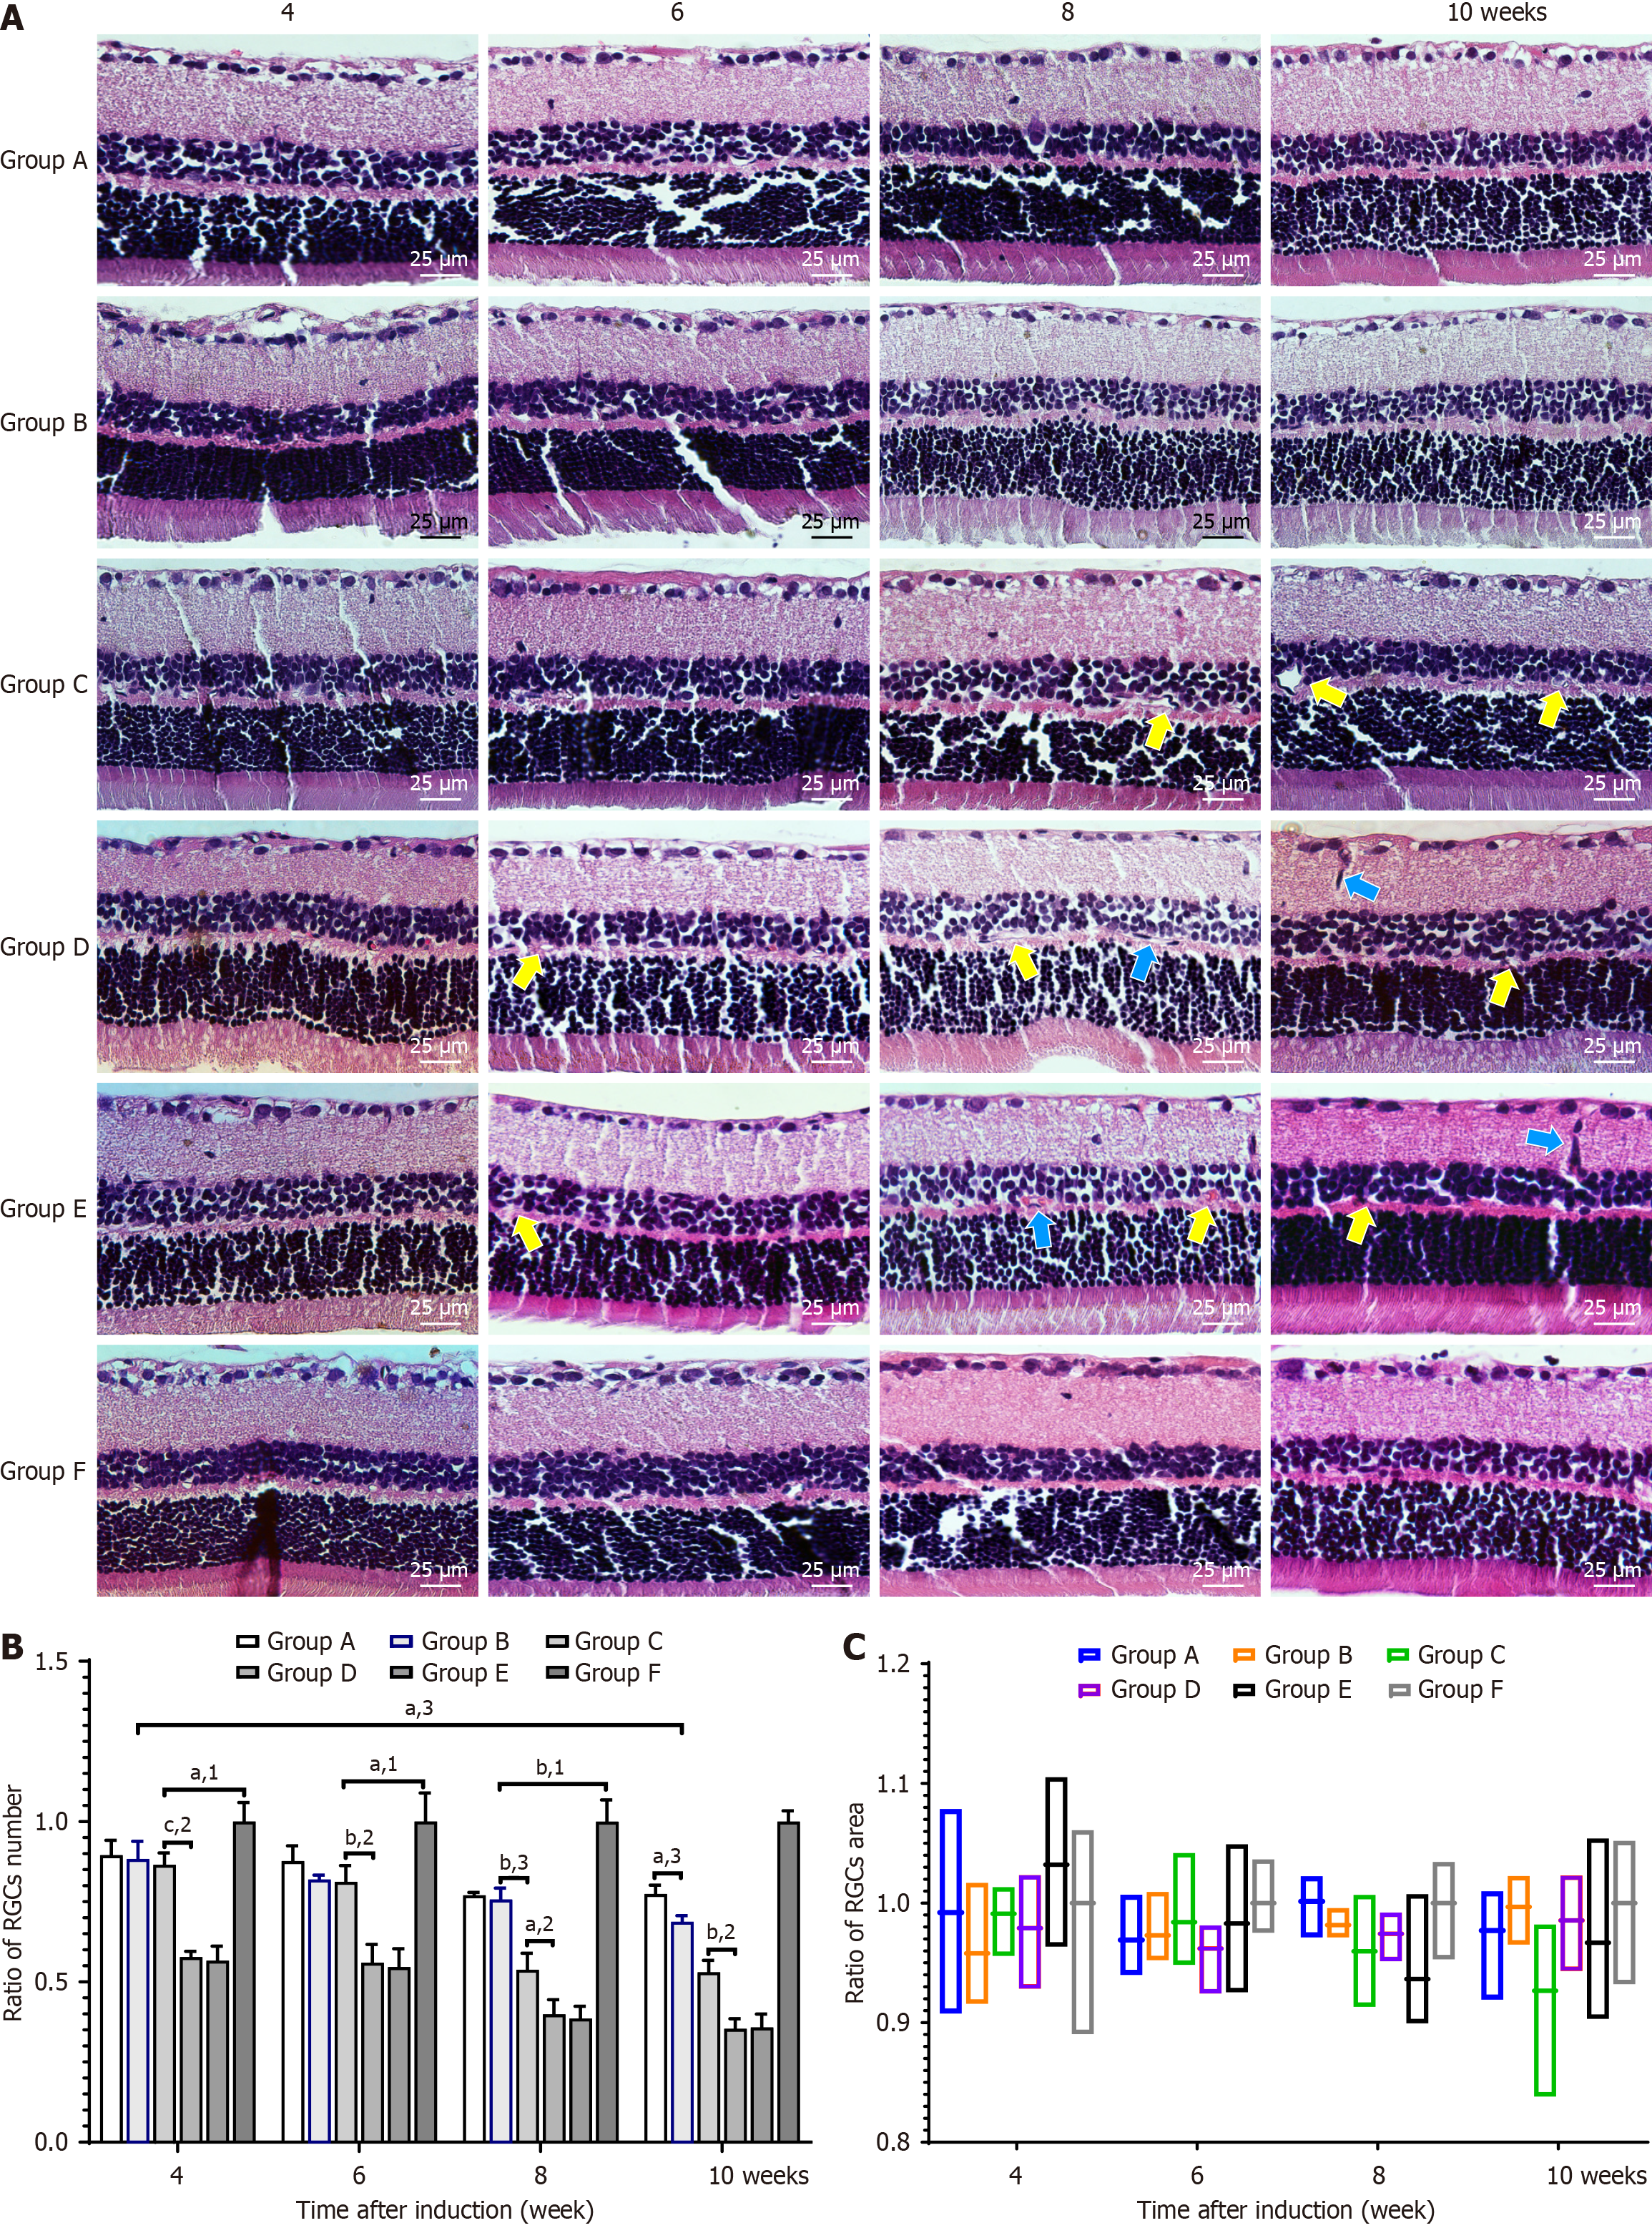
Figure 6 Hematoxylin and eosin staining and the ratio of retinal ganglion cell (RGC) number to RGC area in each group at each time point.
A: Ratio of retinal ganglion cell (RGC) number to RGC area in each group based on retinal tissue hematoxylin and eosin staining (magnification: 400 ×; scale bar: 25 μm); B and C: Ratio of RGC number to RGC area in each group at each time point, respectively. The blue arrows indicate neovascularization buds, while the yellow arrows indicate abnormally dilated microvessels. All results are expressed as the mean ± SD. aP < 0.05. bP < 0.01. cP < 0.001. 1P vs F group. 2P vs C group. 3P vs B group.
- Citation: Lin YT, Tan J, Tao YL, Hu WW, Wang YC, Huang J, Zhou Q, Xiao A. Effect of ranibizumab on diabetic retinopathy via the vascular endothelial growth factor/STAT3/glial fibrillary acidic protein pathway. World J Diabetes 2025; 16(5): 99473
- URL: https://www.wjgnet.com/1948-9358/full/v16/i5/99473.htm
- DOI: https://dx.doi.org/10.4239/wjd.v16.i5.99473


