Copyright
©The Author(s) 2025.
World J Diabetes. May 15, 2025; 16(5): 99473
Published online May 15, 2025. doi: 10.4239/wjd.v16.i5.99473
Published online May 15, 2025. doi: 10.4239/wjd.v16.i5.99473
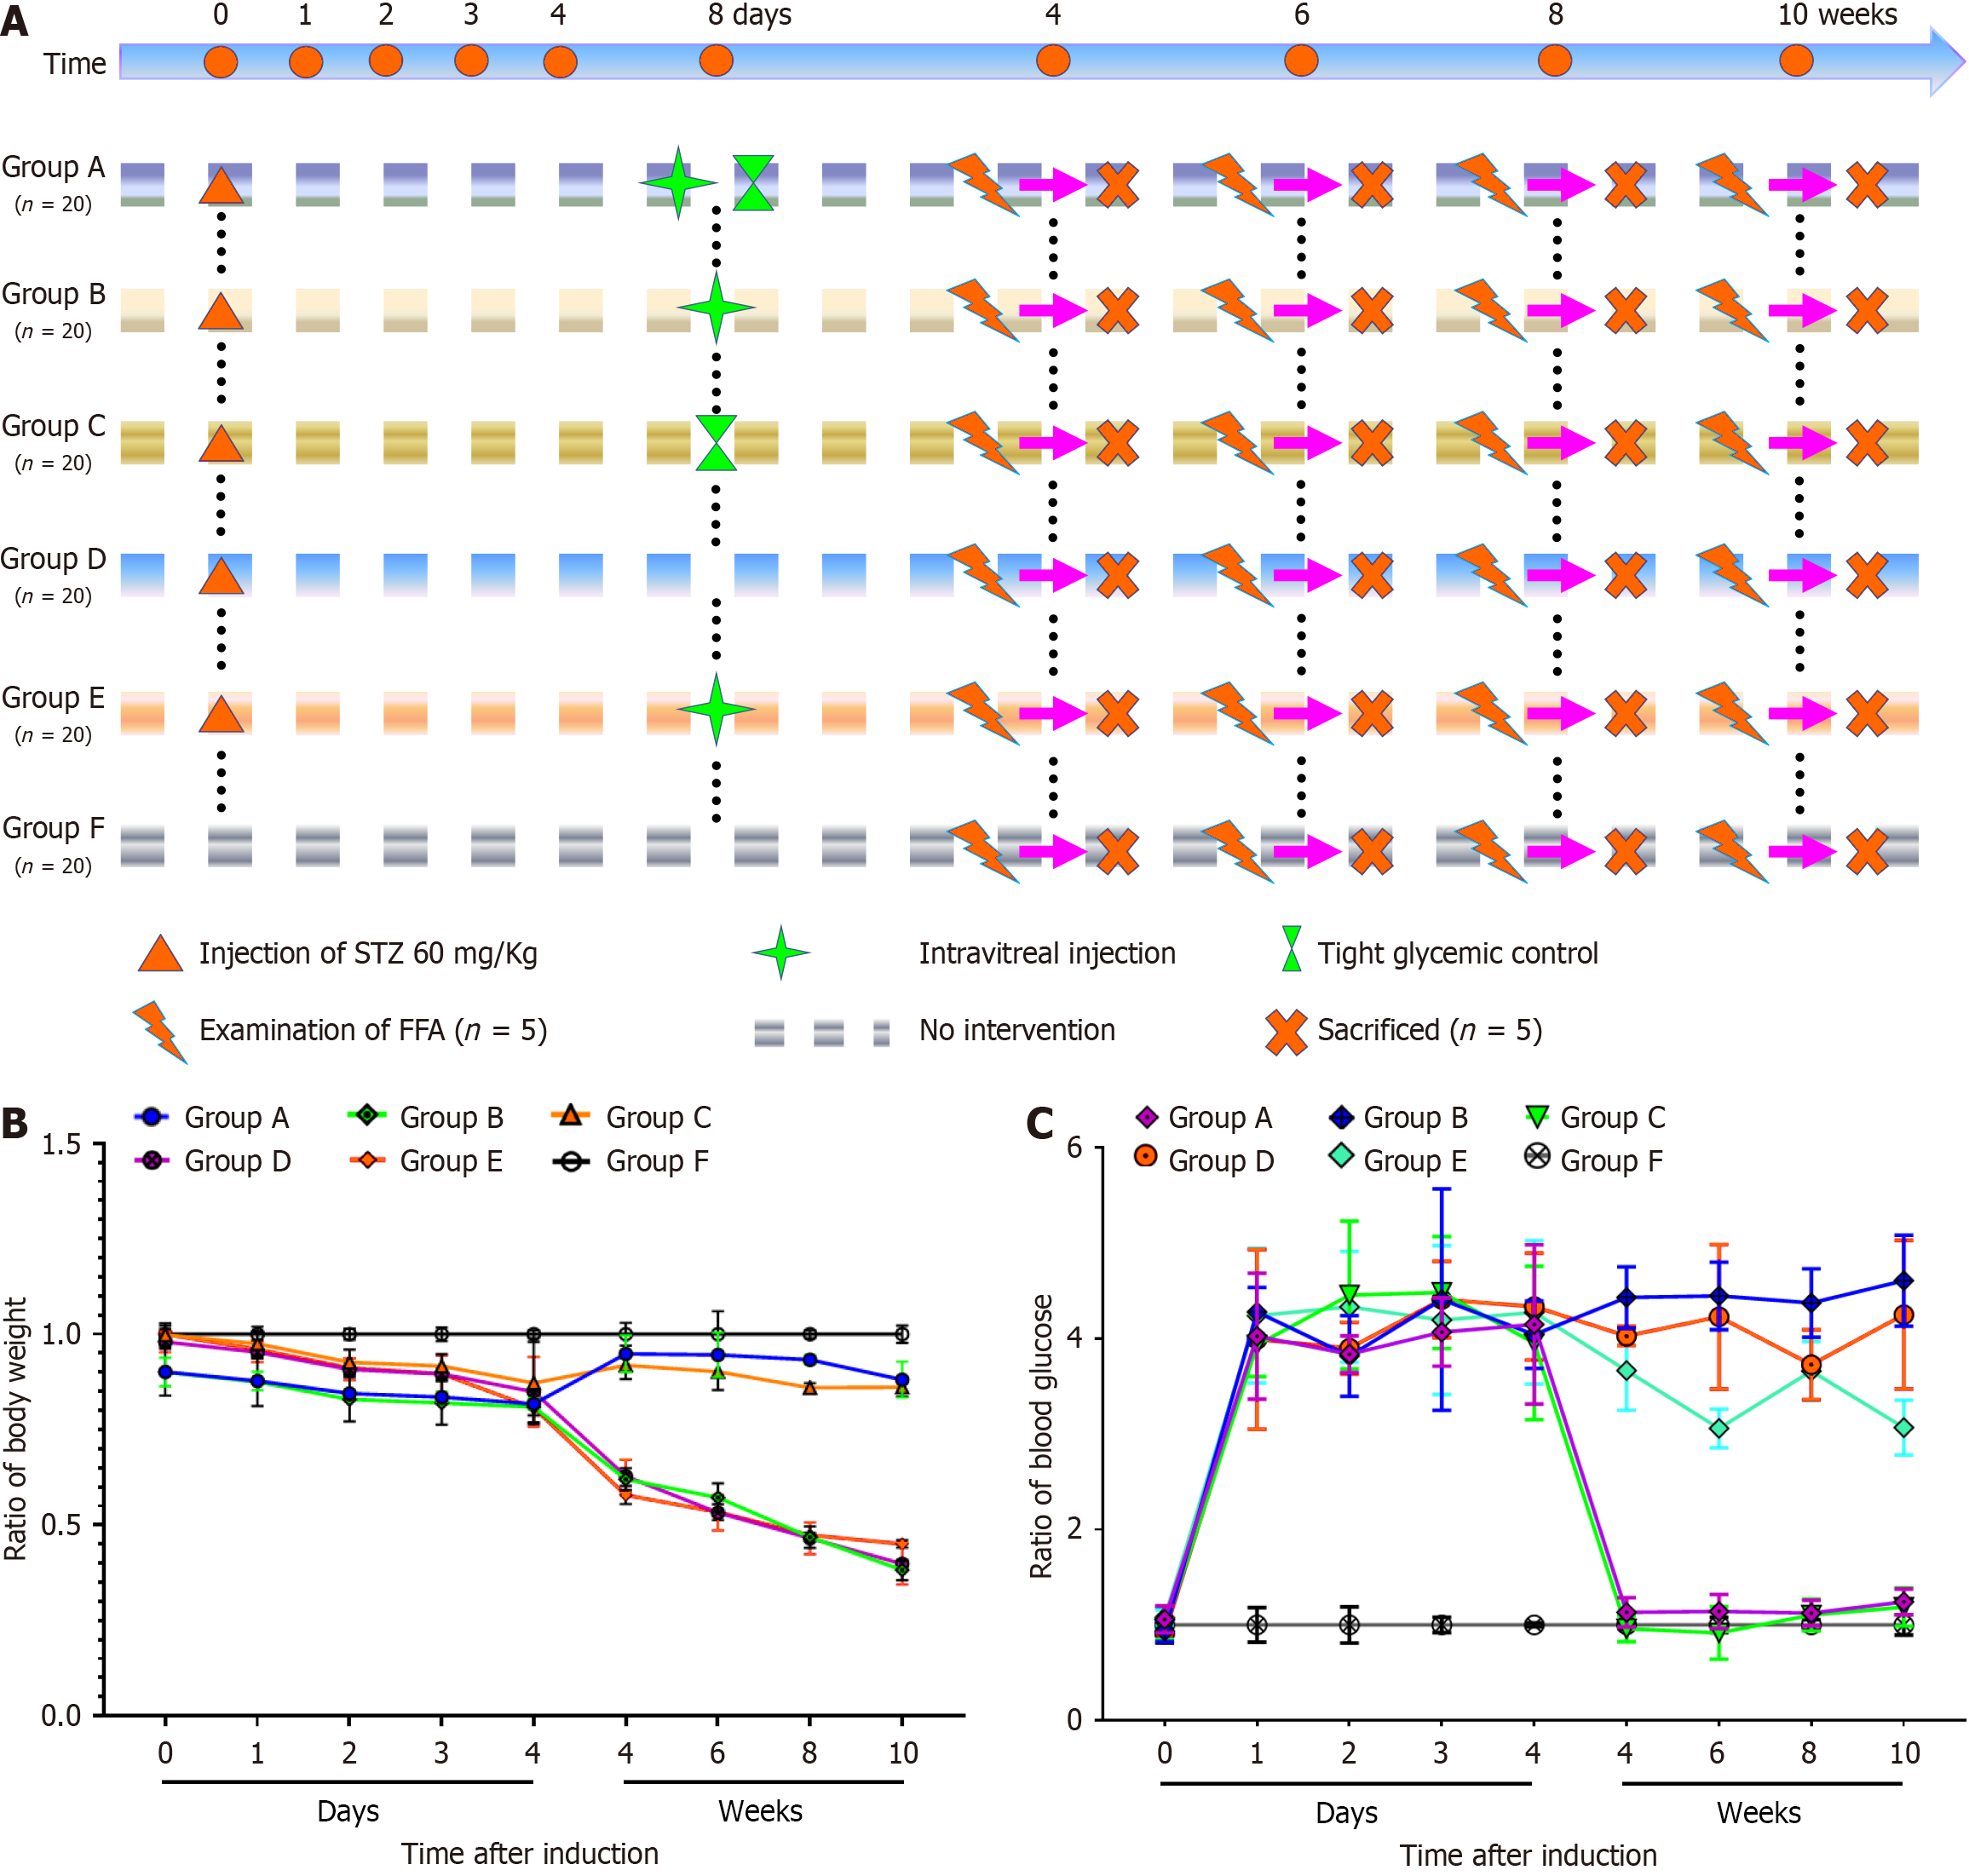
Figure 4 Changes in body weights and blood glucose concentrations of Sprague-Dawley rats within 10 weeks after induction.
A: Experimental flowchart: 100 diabetic rats were randomly divided into Groups A, B, C, D, and E, while 20 normal rats with no treatment were assigned to Group F; B: Changes in the body weights of Sprague-Dawley rats in each group; C: Changes in the blood glucose concentrations of Sprague-Dawley rats in each group. All results are expressed as the mean ± SD. aP < 0.05. cP < 0.001. P vs A group. FFA: Fundus fluorescein angiography; STZ: Streptozotocin.
- Citation: Lin YT, Tan J, Tao YL, Hu WW, Wang YC, Huang J, Zhou Q, Xiao A. Effect of ranibizumab on diabetic retinopathy via the vascular endothelial growth factor/STAT3/glial fibrillary acidic protein pathway. World J Diabetes 2025; 16(5): 99473
- URL: https://www.wjgnet.com/1948-9358/full/v16/i5/99473.htm
- DOI: https://dx.doi.org/10.4239/wjd.v16.i5.99473


