Copyright
©The Author(s) 2025.
World J Diabetes. May 15, 2025; 16(5): 95431
Published online May 15, 2025. doi: 10.4239/wjd.v16.i5.95431
Published online May 15, 2025. doi: 10.4239/wjd.v16.i5.95431
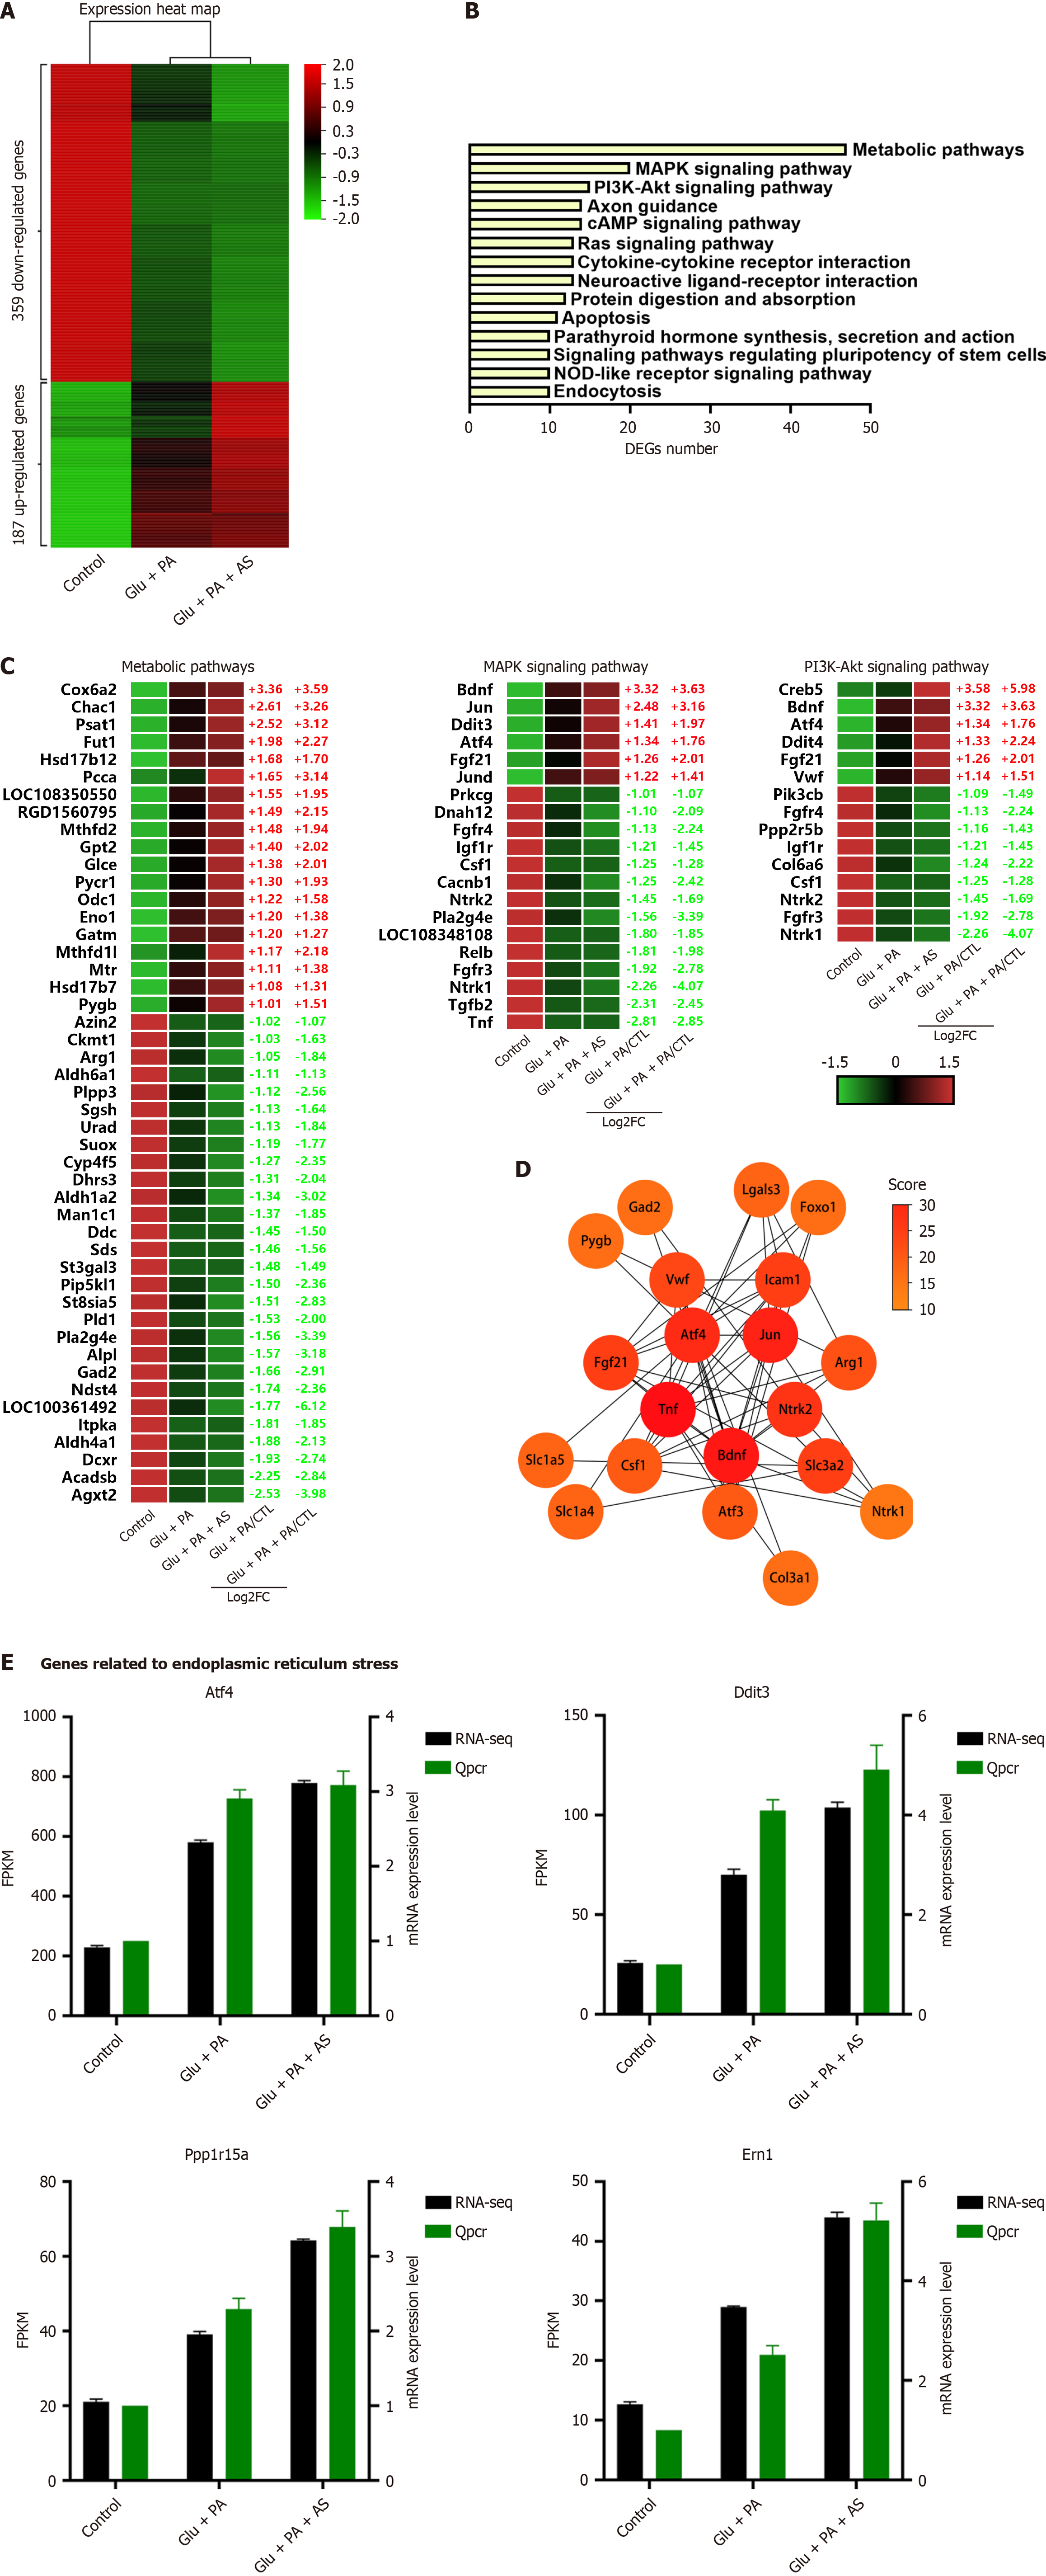
Figure 4 Analysis of differentially expressed genes is associated with forkhead box O1-inhibition reinforced β-cell dedifferentiation.
A: Heatmap of differential genes with a consistent expression trend in high glucose plus palmitate acid (Glu + PA) or high glucose plus palmitate acid plus AS1842856 (Glu + PA + AS), including 187 upregulated genes and 359 downregulated genes. Z-score indicators are shown on the right of the map; B: Kyoto Encyclopedia of Genes and Genomes enrichment pathway of differentially expressed genes (DEGs) in (A); C: Heatmaps of the top three enrichment pathways, including metabolic pathway, mitogen-activated protein kinase pathway and phosphatidylinositol 3-kinase-protein kinase B pathway; D: Top 20 hub genes from the protein-protein interaction network of DEGs. Different scores of the hub genes are shown as gradual colors (yellow indicates low scores, red indicates high scores); E: Verification of quantitative real-time polymerase chain reaction in endoplasmic reticulum stress-related genes. Glu: Glucose; PA: Palmitic acid; AS: AS1842856; MAPK: Mitogen-activated protein kinase; PI3K: Phosphatidylinositol 3-kinase; FC: Fold change; CTL: Cytotoxic T lymphocyte; KEGG: Kyoto Encyclopedia of Genes and Genomes; cAMP: Cyclic adenosine monophosphate; DEGs: Differentially expressed genes; NOD: Nucleotide-binding and oligomerization domain; FPKM: Fragments per kilobase of transcript per million mapped reads.
- Citation: Wang LK, Kong CC, Yu TY, Sun HS, Yang L, Sun Y, Li MY, Wang W. Endoplasmic reticulum stress and forkhead box protein O1 inhibition mediate palmitic acid and high glucose-induced β-cell dedifferentiation. World J Diabetes 2025; 16(5): 95431
- URL: https://www.wjgnet.com/1948-9358/full/v16/i5/95431.htm
- DOI: https://dx.doi.org/10.4239/wjd.v16.i5.95431


