Copyright
©The Author(s) 2025.
World J Diabetes. May 15, 2025; 16(5): 95431
Published online May 15, 2025. doi: 10.4239/wjd.v16.i5.95431
Published online May 15, 2025. doi: 10.4239/wjd.v16.i5.95431
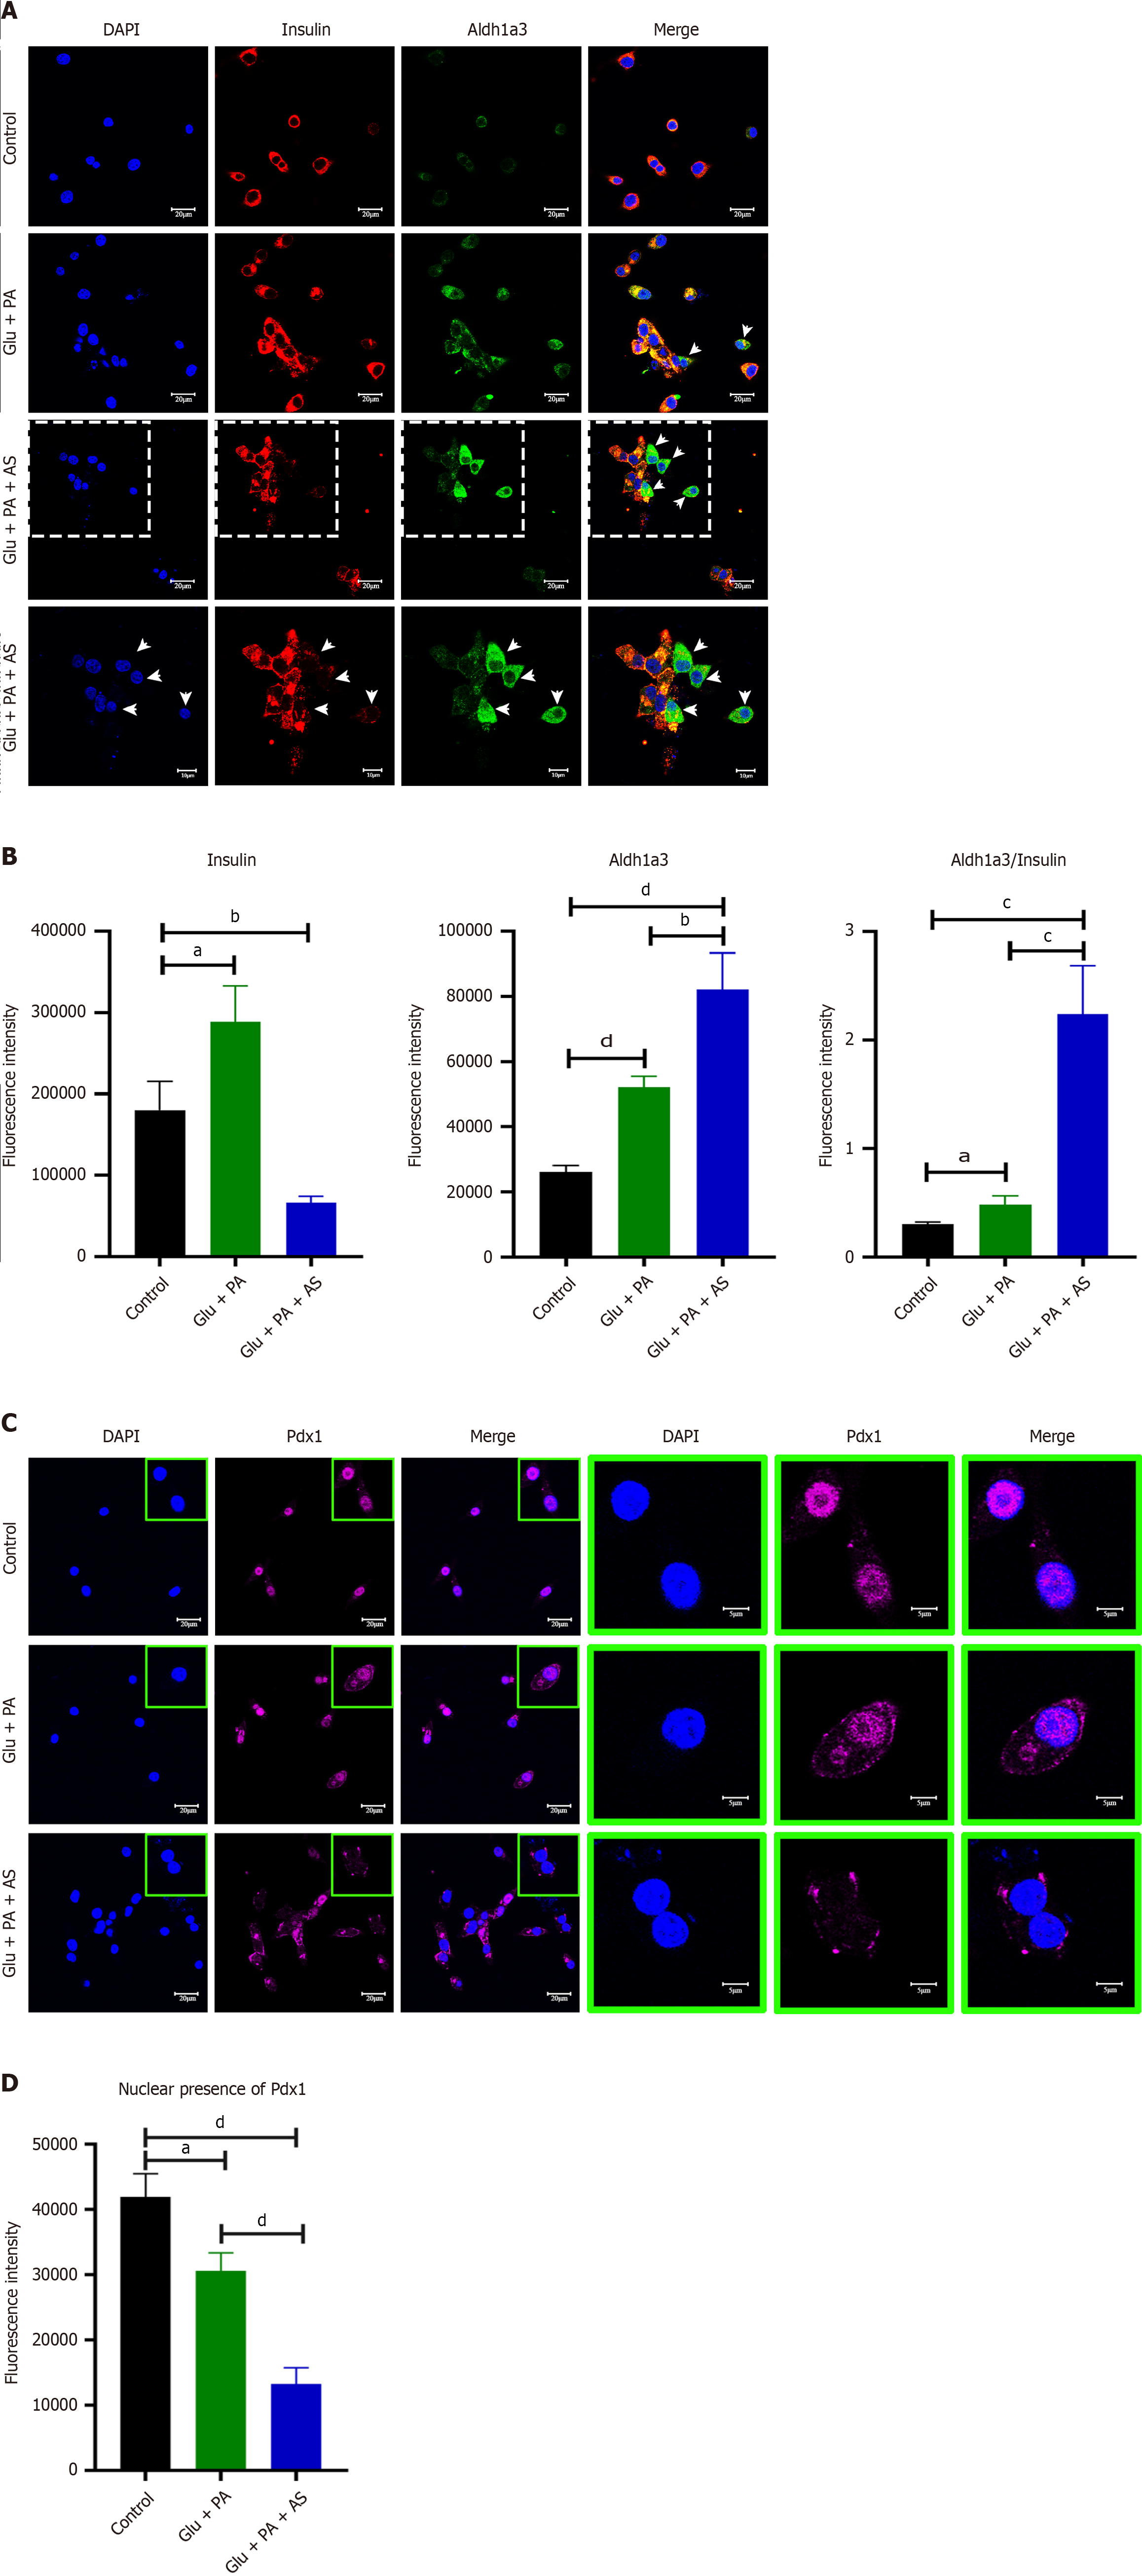
Figure 2 High glucose and palmitic acid increased aldehyde dehydrogenase 1 family member A3 level and pancreatic and duodenal homeobox 1 translocation.
A: Immunofluorescence staining with 4’,6-Diamidino-2’-phenylindole (DAPI) (blue), insulin (red) and aldehyde dehydrogenase 1 family member A3 (Aldh1a3) (green) of INS-1 cell treated with bovine serum albumin (BSA) (control), high glucose plus palmitate acid (Glu + PA) or high glucose plus palmitate acid plus AS1842856 (Glu + PA + AS). Scale bars indicate 20 μm. Arrows indicate the Aldh1a3-positive cell. The lower panel indicates magnified images, shown in dashed squares. Scale bars indicate 10 μm; B: Quantification of the fluorescence intensity of insulin, Aldh1a3, and the ratio of Aldh1a3/insulin. Three different experiments were performed; C: Immunofluorescence with DAPI (blue) and pancreatic and duodenal homeobox 1 (Pdx1) (magenta) of INS-1 treated with BSA (control), high Glu + PA, or high Glu + PA + AS. Scale bars indicate 20 μm; D: Quantification of Pdx1 intensity in nuclei, and three different experiments were performed. Data are presented as means ± SEM. aP < 0.05. bP < 0.01. cP < 0.001. dP < 0.0001. Glu: Glucose; PA: Palmitic acid; AS: AS1842856; Pdx1: Pancreatic and duodenal homeobox 1; Aldh1a3: Aldehyde dehydrogenase 1 family member A3; DAPI: 4’,6-Diamidino-2’-phenylindole.
- Citation: Wang LK, Kong CC, Yu TY, Sun HS, Yang L, Sun Y, Li MY, Wang W. Endoplasmic reticulum stress and forkhead box protein O1 inhibition mediate palmitic acid and high glucose-induced β-cell dedifferentiation. World J Diabetes 2025; 16(5): 95431
- URL: https://www.wjgnet.com/1948-9358/full/v16/i5/95431.htm
- DOI: https://dx.doi.org/10.4239/wjd.v16.i5.95431


