Copyright
©The Author(s) 2025.
World J Diabetes. May 15, 2025; 16(5): 95431
Published online May 15, 2025. doi: 10.4239/wjd.v16.i5.95431
Published online May 15, 2025. doi: 10.4239/wjd.v16.i5.95431
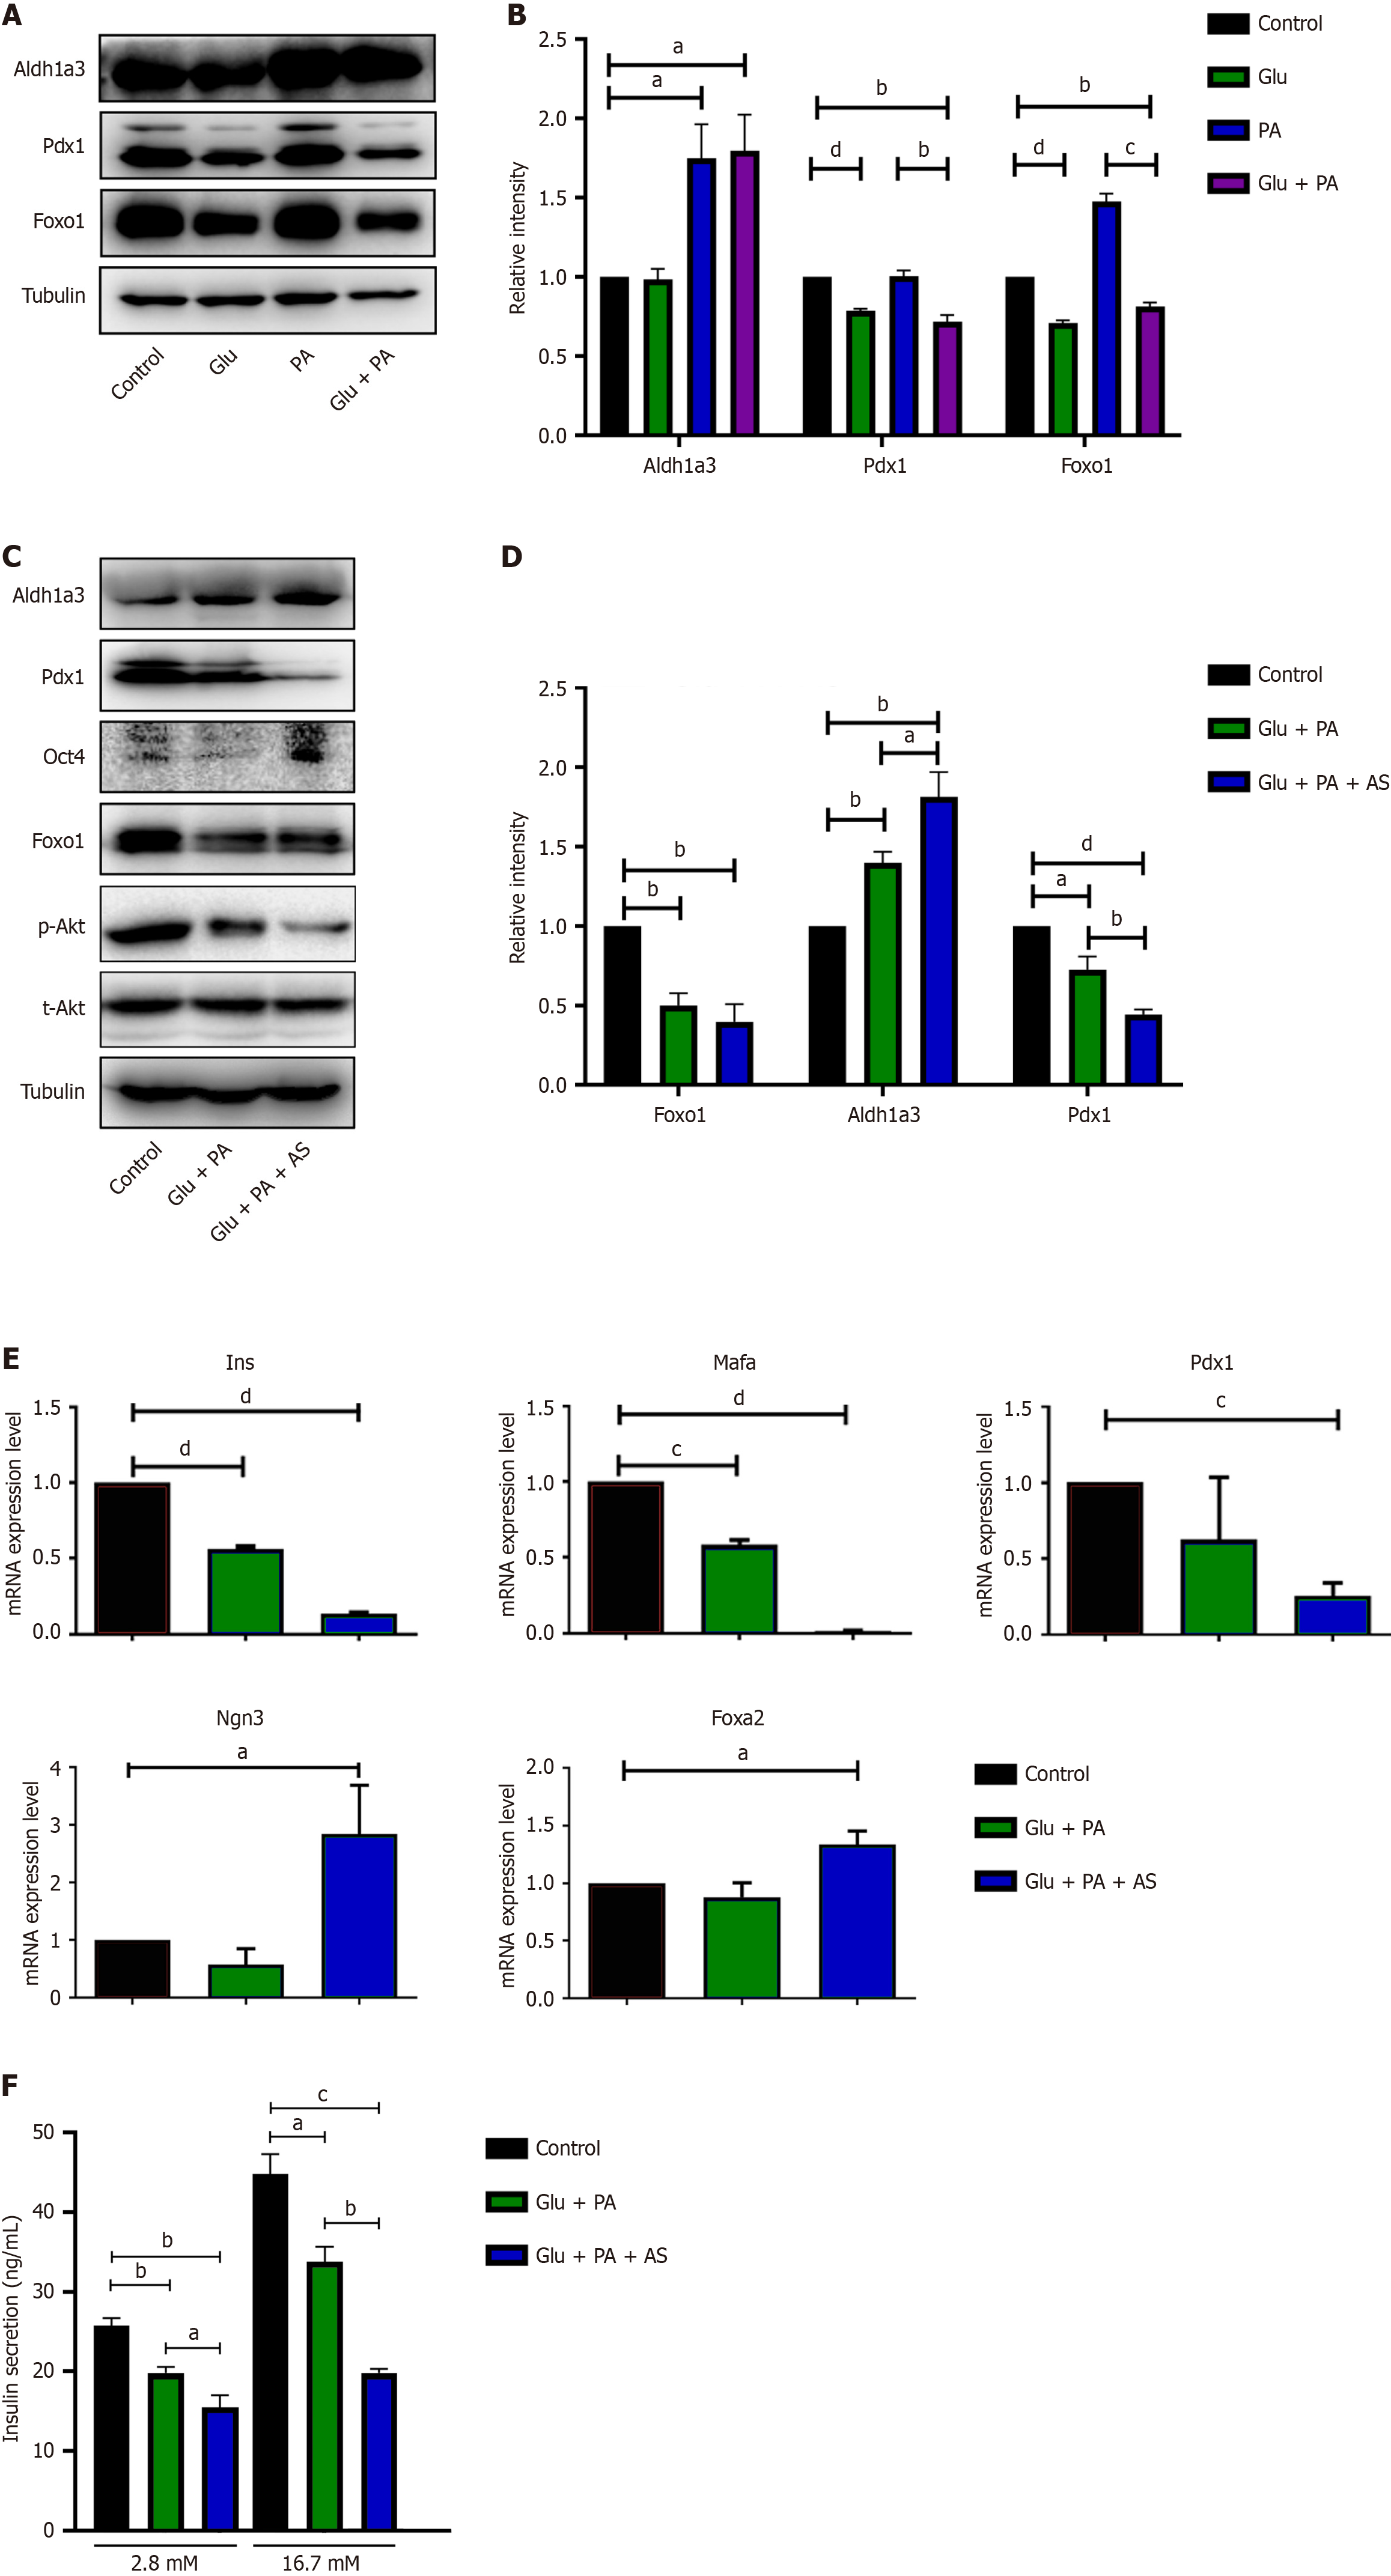
Figure 1 Palmitic acid and high glucose induced INS-1 cell dedifferentiation.
A and B: INS-1 cell treated with bovine serum albumin (BSA) (control), 25 mmol/L glucose (Glu), 300 μmol/L palmitic acid (PA), or Glu + PA for 36 hours, and western blot (A) and quantification (B) of aldehyde dehydrogenase 1 family member A3 (Aldh1a3), pancreatic and duodenal homeobox 1 (Pdx1) and forkhead box O1 (Foxo1); C and D: INS-1 cell treated with BSA (control), 25 mmol/L Glu + 300 μmol/L PA, or 25 mmol/L Glu + 300 μmol/L PA + 1 μmol/L AS1842856 (AS) for 36 hours, and western blot (C) and quantification (D) of Aldh1a3, Pdx1 and Foxo1; E: Quantification of the mRNA levels of Ins, Mafa, Pdx1, Ngn3 and Foxa2 in INS-1 cell after 36 hours of treatment with Glu + PA or Glu + PA + AS relative to the untreated control. The mRNA expression of the treatment group was indicated by the fold change compared with that of the control group, and three independent samples were performed; F: Insulin secretion was stimulated with high glucose (16.7 mmol/L) and low glucose (2.8 mmol/L) in INS-1 cells after 36 hours of treatment with Glu + PA or Glu + PA + AS. Data are presented as means ± SEM. aP < 0.05. bP < 0.01. cP < 0.001. dP < 0.0001. Glu: Glucose; PA: Palmitic acid; AS: AS1842856; Pdx1: Pancreatic and duodenal homeobox 1; Aldh1a3: Aldehyde dehydrogenase 1 family member A3; Foxo1: Forkhead box O1; Oct4: Octamer-binding transcription factor 4.
- Citation: Wang LK, Kong CC, Yu TY, Sun HS, Yang L, Sun Y, Li MY, Wang W. Endoplasmic reticulum stress and forkhead box protein O1 inhibition mediate palmitic acid and high glucose-induced β-cell dedifferentiation. World J Diabetes 2025; 16(5): 95431
- URL: https://www.wjgnet.com/1948-9358/full/v16/i5/95431.htm
- DOI: https://dx.doi.org/10.4239/wjd.v16.i5.95431


