Copyright
©The Author(s) 2025.
World J Diabetes. May 15, 2025; 16(5): 104350
Published online May 15, 2025. doi: 10.4239/wjd.v16.i5.104350
Published online May 15, 2025. doi: 10.4239/wjd.v16.i5.104350
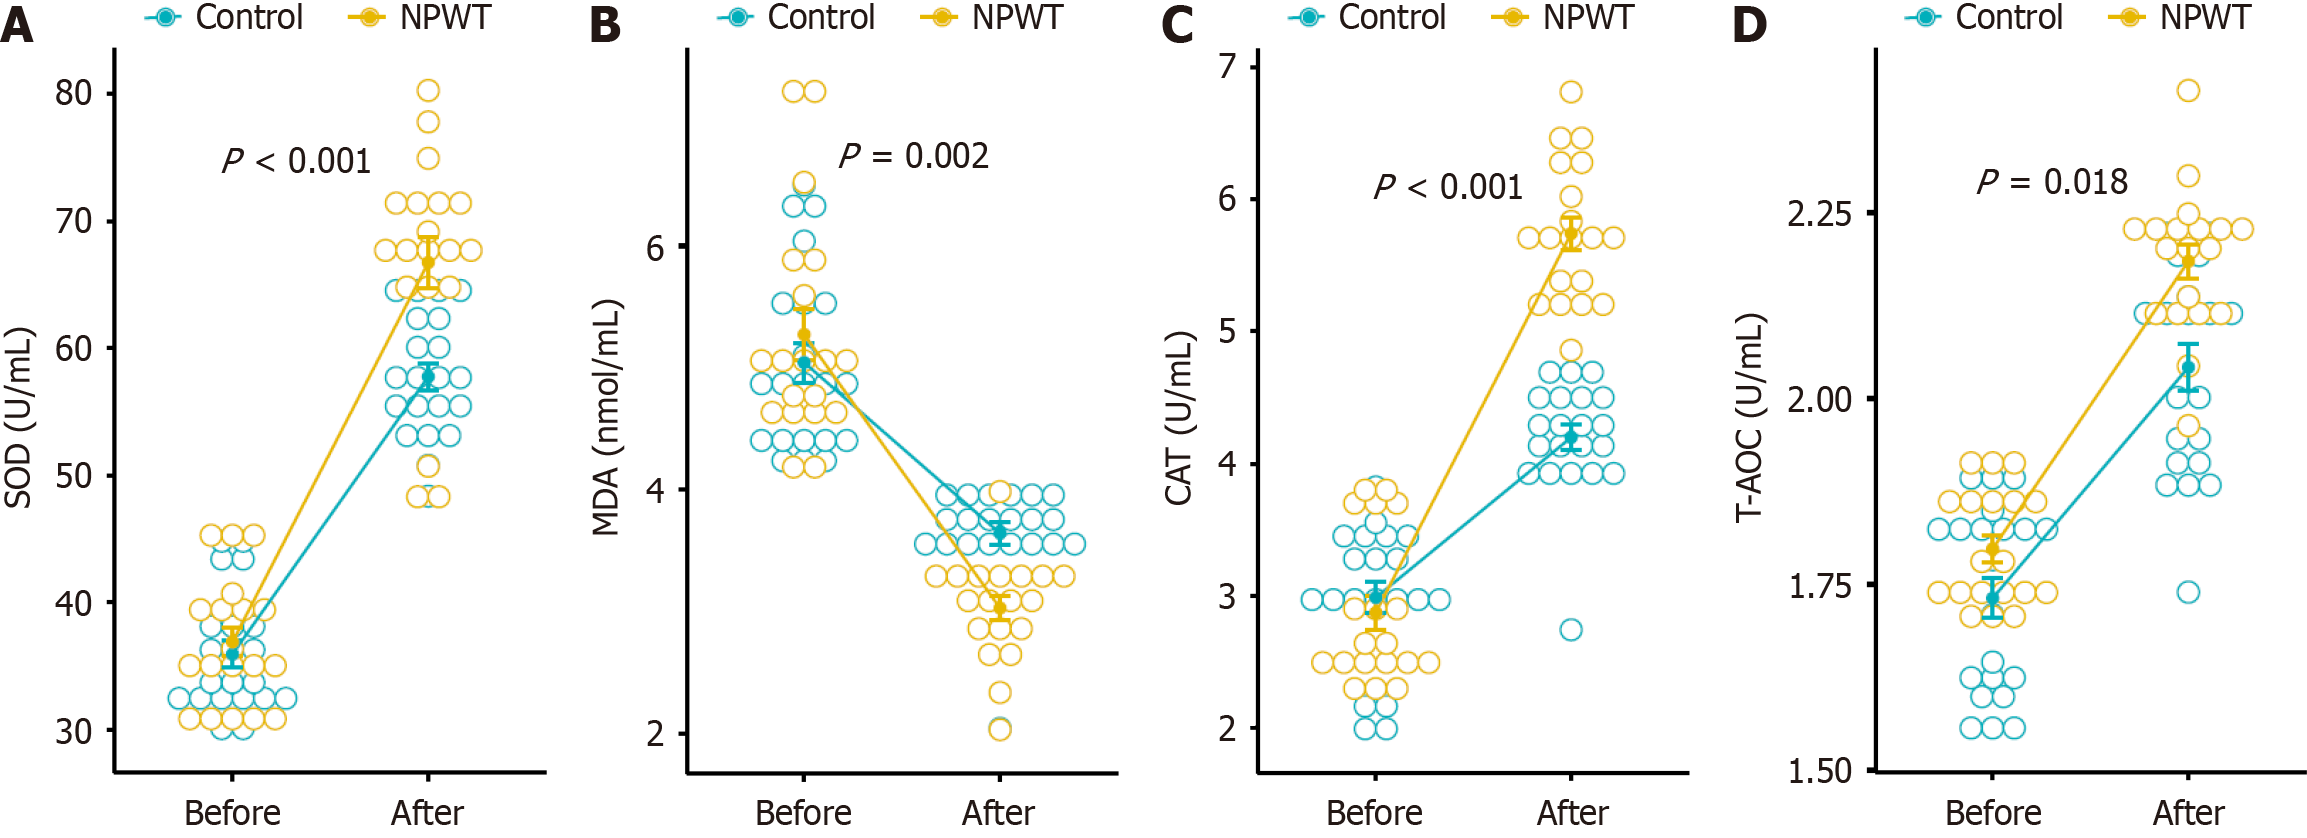
Figure 4 Comparison of levels of oxidative stress makers between the two groups.
A: Superoxide dismutase; B: Malondialdehyde; C: Catalase; D: Total antioxidant capacity. AOC: Total antioxidant capacity; CAT: Catalase; MDA: Malondialdehyde; SOD: Superoxide dismutase; T-NPWT: Negative pressure wound therapy.
- Citation: Sun HJ, Si SW, Ma YM, Liu XK, Geng HF, Liang J. Role of nuclear factor erythroid 2-related factor 2 in negative pressure wound therapy for diabetic foot ulcers. World J Diabetes 2025; 16(5): 104350
- URL: https://www.wjgnet.com/1948-9358/full/v16/i5/104350.htm
- DOI: https://dx.doi.org/10.4239/wjd.v16.i5.104350


