Copyright
©The Author(s) 2025.
World J Diabetes. May 15, 2025; 16(5): 103915
Published online May 15, 2025. doi: 10.4239/wjd.v16.i5.103915
Published online May 15, 2025. doi: 10.4239/wjd.v16.i5.103915
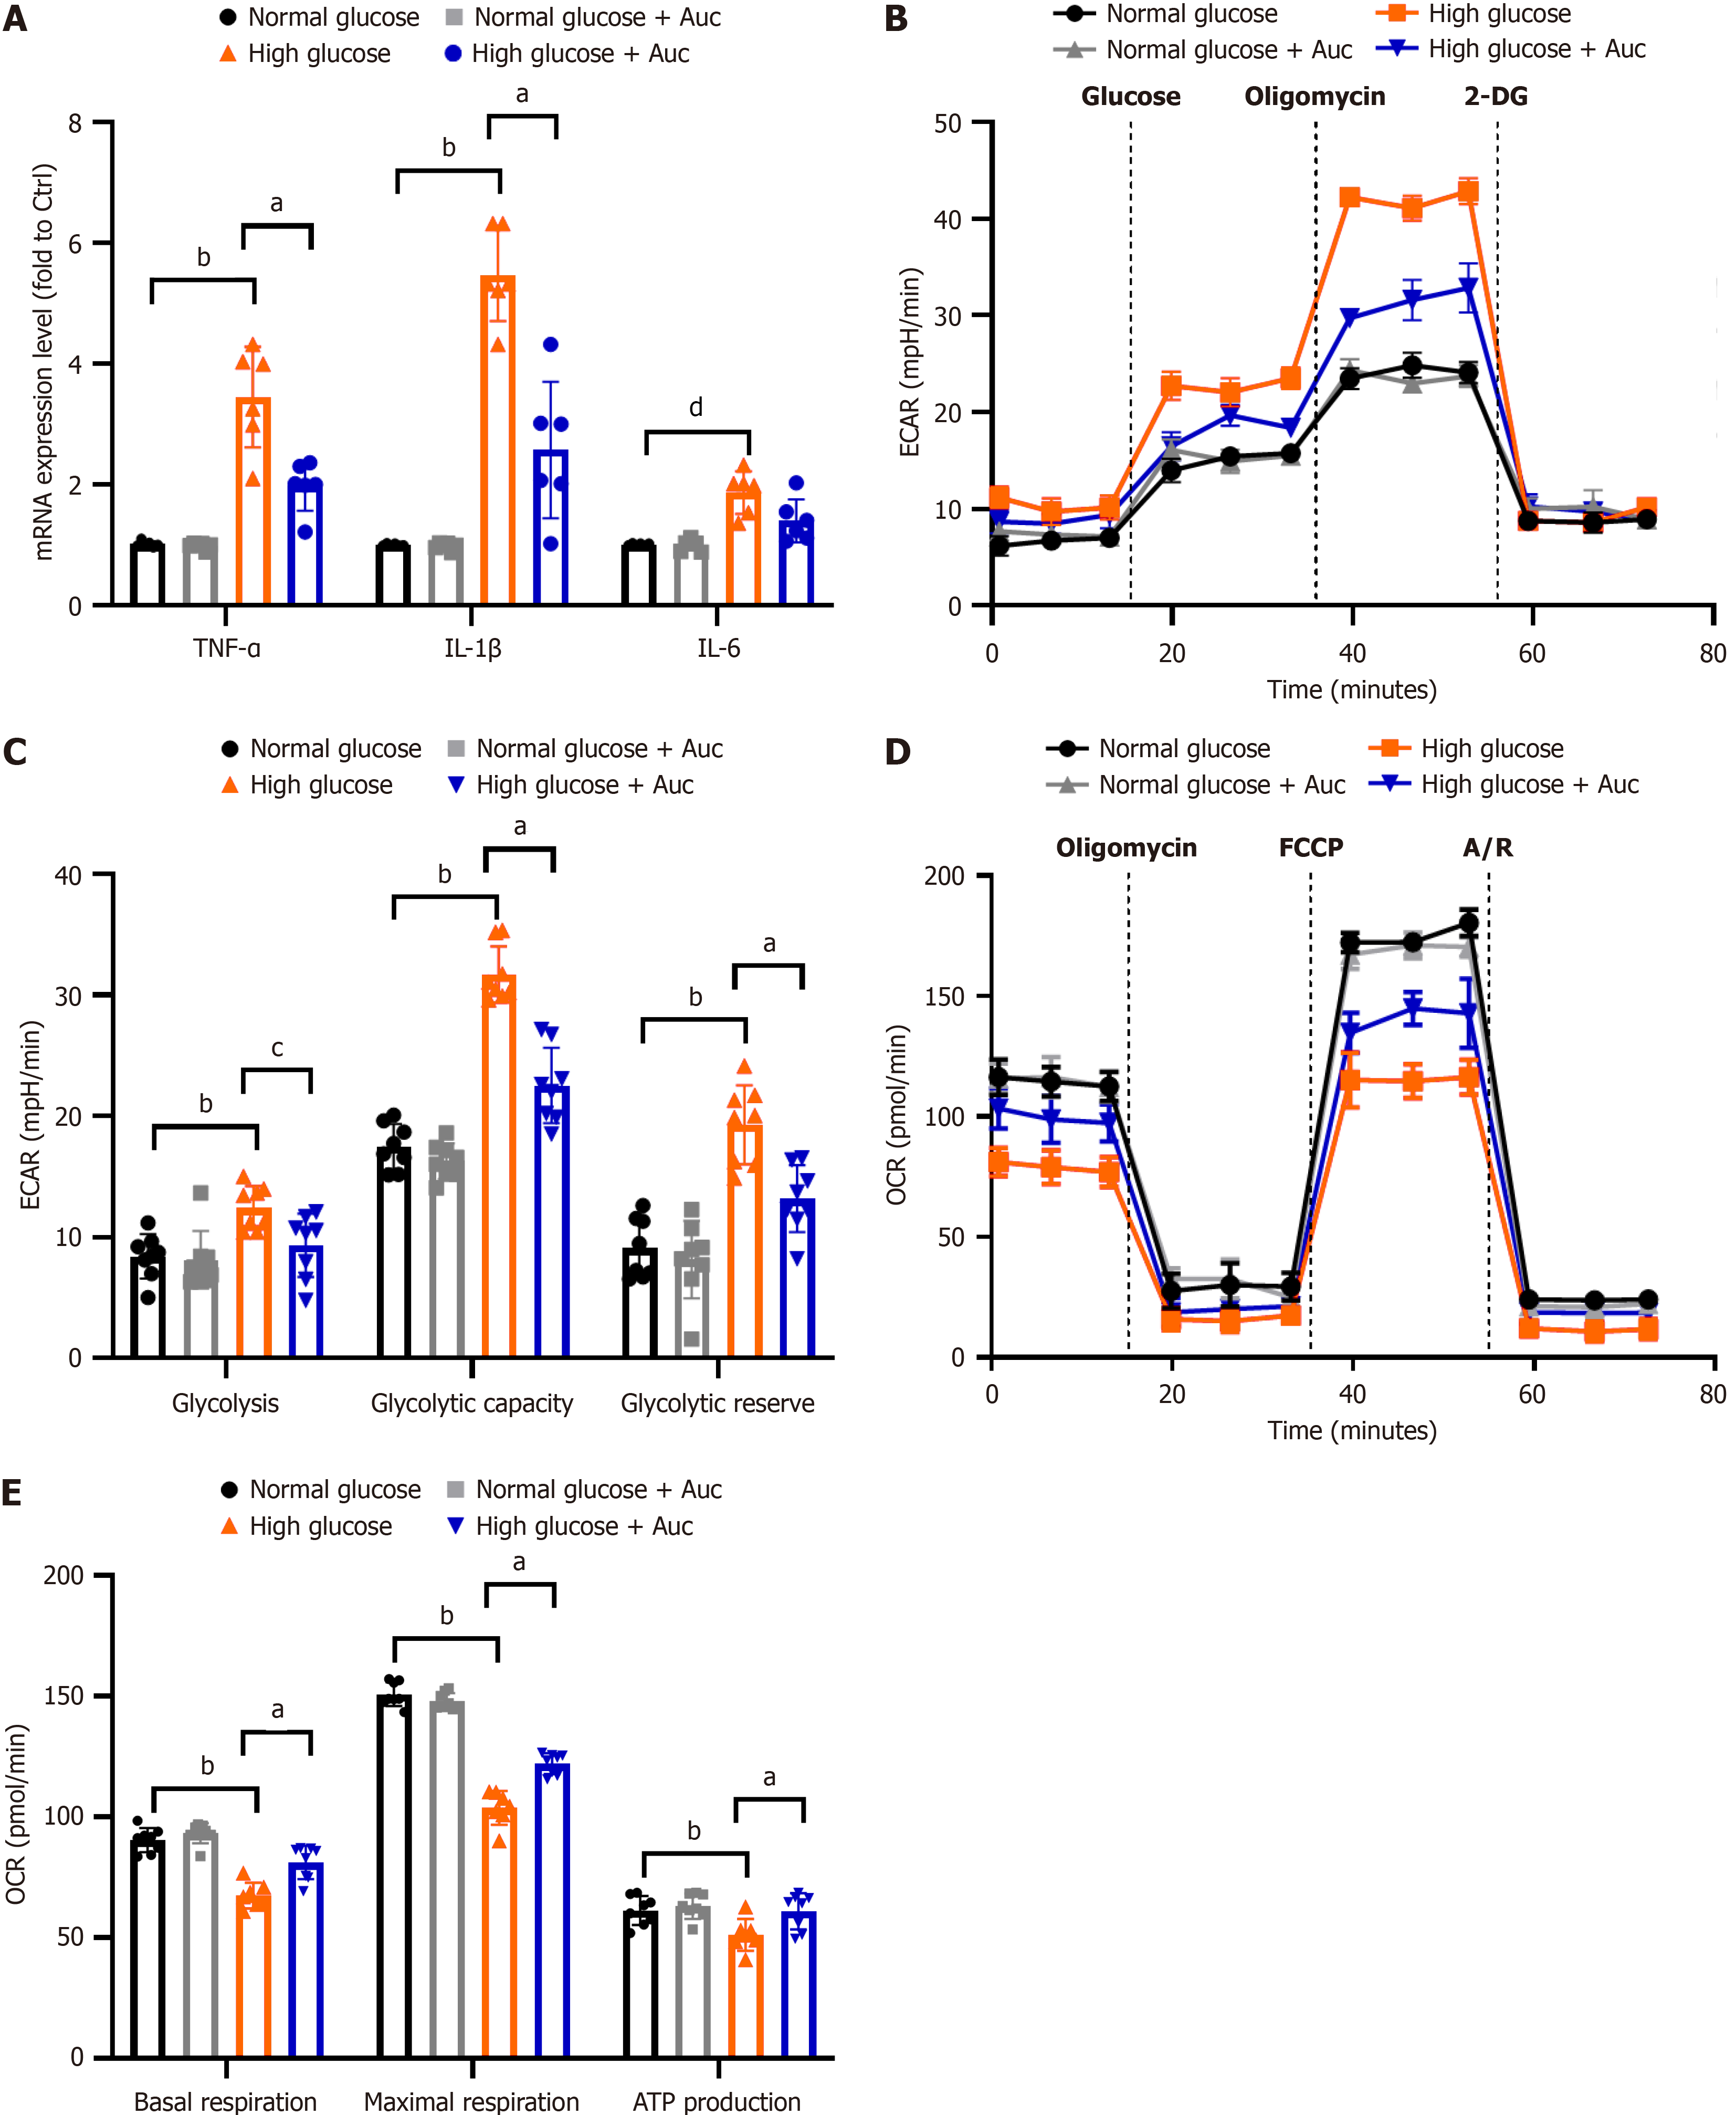
Figure 4 Aucubin reduced aerobic glycolysis and inflammation in the BV-2 cell.
A: the mRNA levels of pro-inflammatory cytokine; B-E: The experimental program of the extracellular acidification rate (B and C) and oxygen consumption rate (D and E) of BV-2 measured by Seahorse XFe96 Extracellular Flux Analyzer. Data are expressed as mean ± SEM. n = 6. aP < 0.01 high glucose vs high glucose + auccubin (Auc); bP < 0.01 normal glucose vs high glucose; cP < 0.05 high glucose vs high glucose + Auc; dP < 0.05 normal glucose vs high glucose. ECAR: Extracellular acidification rate; 2-DG: 2-deoxy-d-glucose; OCR: Oxygen consumption rate; FCCP: Carbonyl cyanide-p-trifluoromethoxyphenylhydrazone; Auc: Aucubin; TNF-α: Tumour necrosis factor-α; IL: Interleukin.
- Citation: Zheng XZ, Yu HY, Chen YR, Fang JS. Aucubin mitigates the elevation of microglial aerobic glycolysis and inflammation in diabetic neuropathic pain via aldose reductase. World J Diabetes 2025; 16(5): 103915
- URL: https://www.wjgnet.com/1948-9358/full/v16/i5/103915.htm
- DOI: https://dx.doi.org/10.4239/wjd.v16.i5.103915


